Fig. 11
Download original image
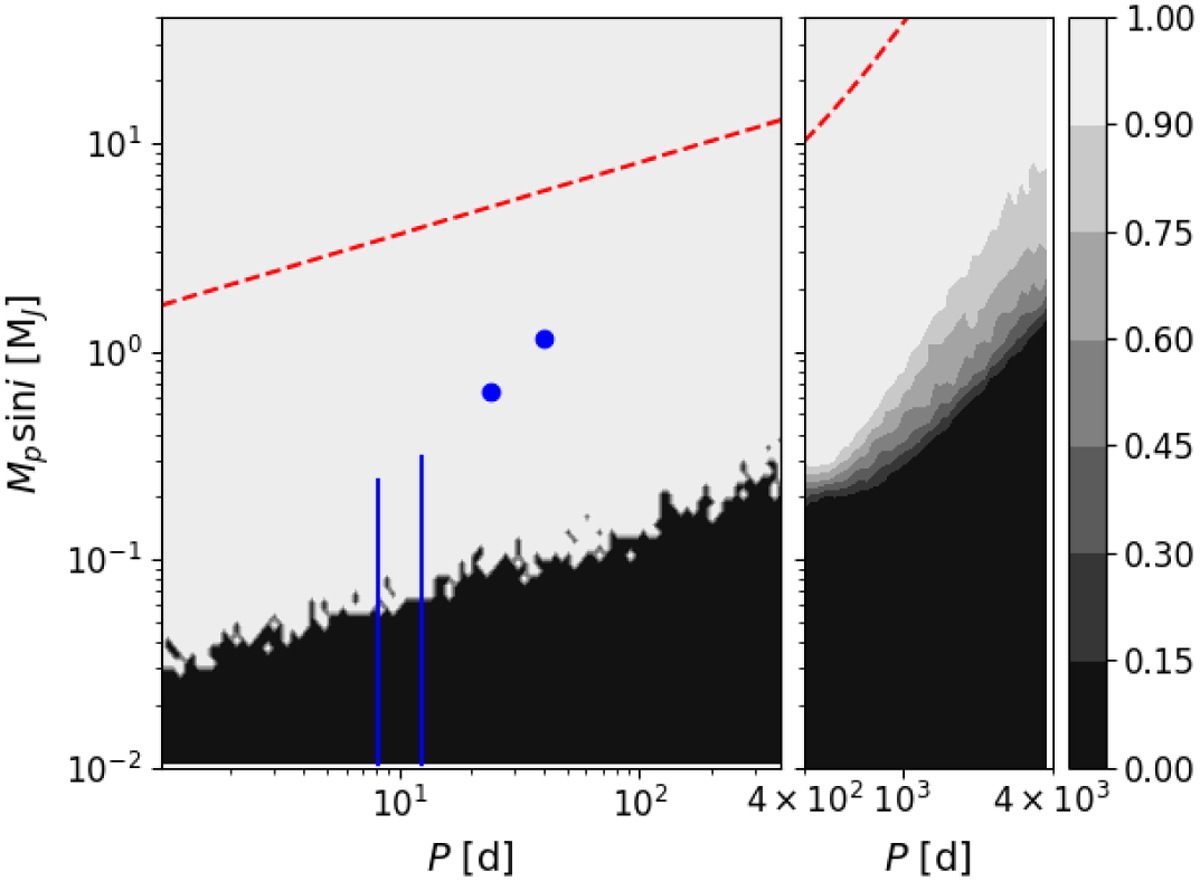
Detection function map of the RV time series of V1298 Tau from Suárez Mascareño et al. (2022), with the stellar activity already removed (i.e., the optimistic case). The color scale expresses the detection function, while the red dashed lines correspond to the 90% detection threshold including the stellar activity in the modeling (i.e., the pessimistic case). The blue circles correspond to the position of the measured planets in the systems, while the blue lines mark the upper limits of the planets with no mass-measurement yet. The left panel shows the Bayesian detection map computed for P < 400 days, while the right panel shows the inject-recovery detection map computed for 400 < P < 4000 days.
Current usage metrics show cumulative count of Article Views (full-text article views including HTML views, PDF and ePub downloads, according to the available data) and Abstracts Views on Vision4Press platform.
Data correspond to usage on the plateform after 2015. The current usage metrics is available 48-96 hours after online publication and is updated daily on week days.
Initial download of the metrics may take a while.