Fig. 6.
Download original image
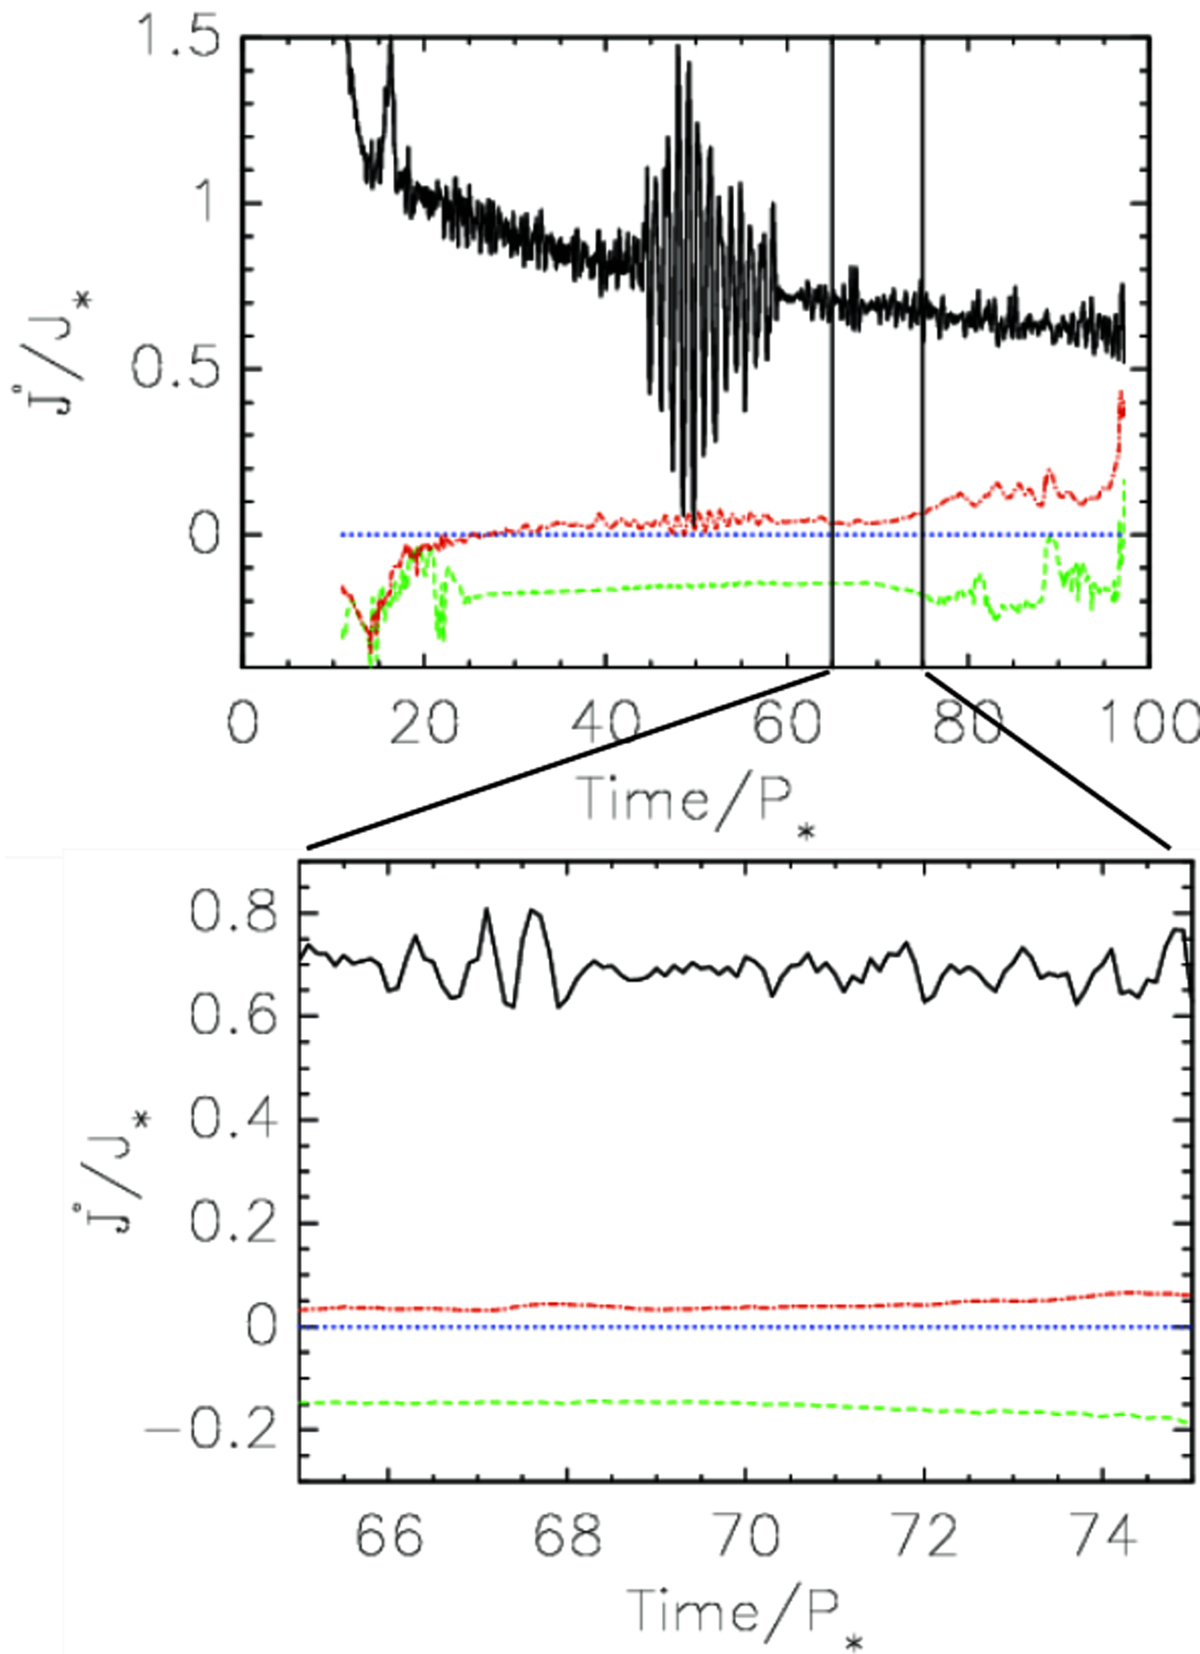
Torques on the star, mostly exerted by the Maxwell stresses, in the simulation b5, which is a DCE1 from Fig. 1 with the magnetospheric ejection, and mass fluxes shown in Fig. 5. The quasi-stationary interval between the vertical lines is shown in detail in the bottom panel. With the dashed (green) line is shown the torque by the stellar wind. The torques by the matter flowing onto the star through the accretion column from the distance beyond and below the corotation radius Rcor are shown with the dotted (blue) and solid (black) lines. With the dot-dashed (red) line is shown the torque exerted on the star by the magnetospheric ejection. Positive torque spins the star up, and negative slows down its rotation. In this case, the stellar rotation rate increases, so the star is spun up because of the star-disk magnetospheric interaction. In the employed units of ![]() the values correspond, in the case of YSOs, to the stellar spin-up or spin-down in Myrs.
the values correspond, in the case of YSOs, to the stellar spin-up or spin-down in Myrs.
Current usage metrics show cumulative count of Article Views (full-text article views including HTML views, PDF and ePub downloads, according to the available data) and Abstracts Views on Vision4Press platform.
Data correspond to usage on the plateform after 2015. The current usage metrics is available 48-96 hours after online publication and is updated daily on week days.
Initial download of the metrics may take a while.