Fig. 5.
Download original image
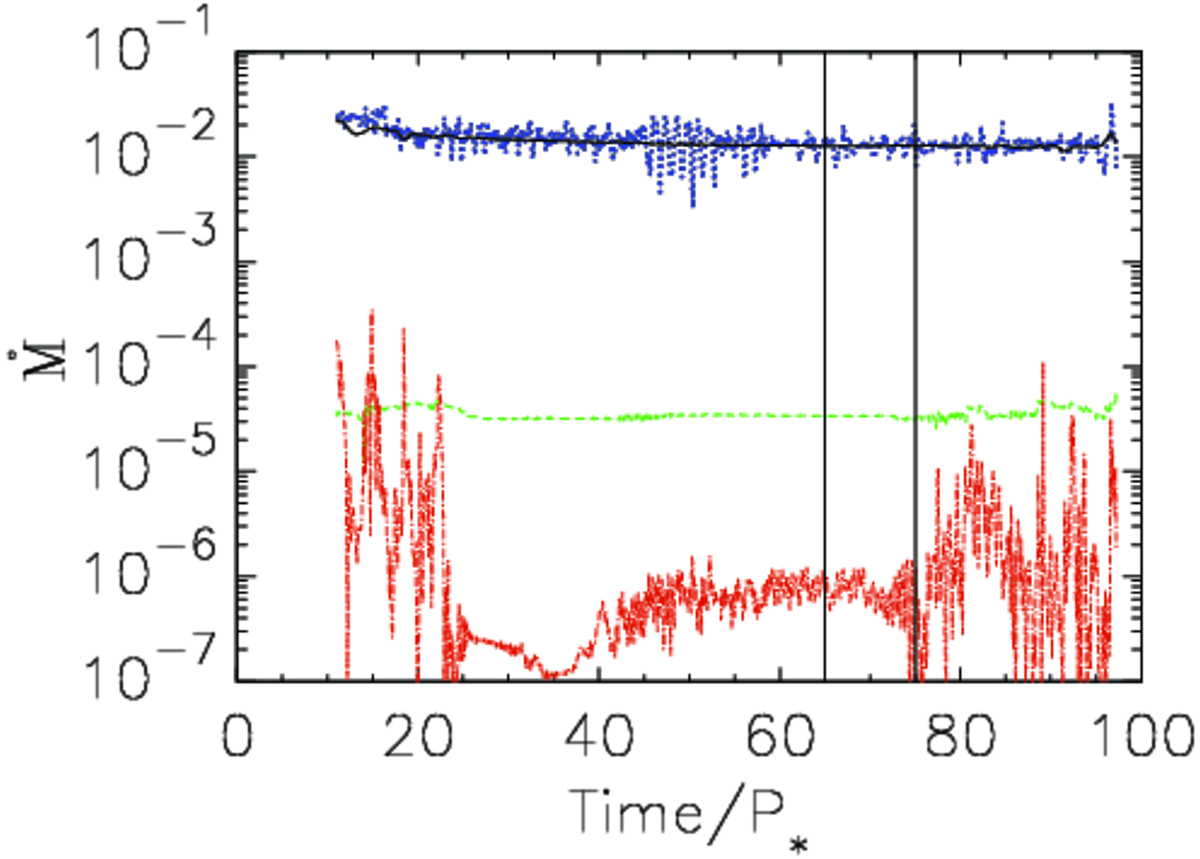
Mass fluxes in the code units ![]() in the various flow components in the simulation b5, shown in Fig. 1. With vertical solid lines is indicated the time interval in which we average the fluxes in each of the flow components. With the solid (black) line is shown the mass flux through the disk at R = 12R⋆ and with the dotted (blue) line the mass flux loaded onto the star through the accretion column. Those two fluxes are much larger than the fluxes in the other components of the flow. The mass flux flowing through the magnetospheric ejection at the radius R = 12R⋆ is shown with the dot-dashed (red) line, and the mass flux into the stellar wind from the vicinity of the stellar surface is shown with the long-dashed (green) line.
in the various flow components in the simulation b5, shown in Fig. 1. With vertical solid lines is indicated the time interval in which we average the fluxes in each of the flow components. With the solid (black) line is shown the mass flux through the disk at R = 12R⋆ and with the dotted (blue) line the mass flux loaded onto the star through the accretion column. Those two fluxes are much larger than the fluxes in the other components of the flow. The mass flux flowing through the magnetospheric ejection at the radius R = 12R⋆ is shown with the dot-dashed (red) line, and the mass flux into the stellar wind from the vicinity of the stellar surface is shown with the long-dashed (green) line.
Current usage metrics show cumulative count of Article Views (full-text article views including HTML views, PDF and ePub downloads, according to the available data) and Abstracts Views on Vision4Press platform.
Data correspond to usage on the plateform after 2015. The current usage metrics is available 48-96 hours after online publication and is updated daily on week days.
Initial download of the metrics may take a while.