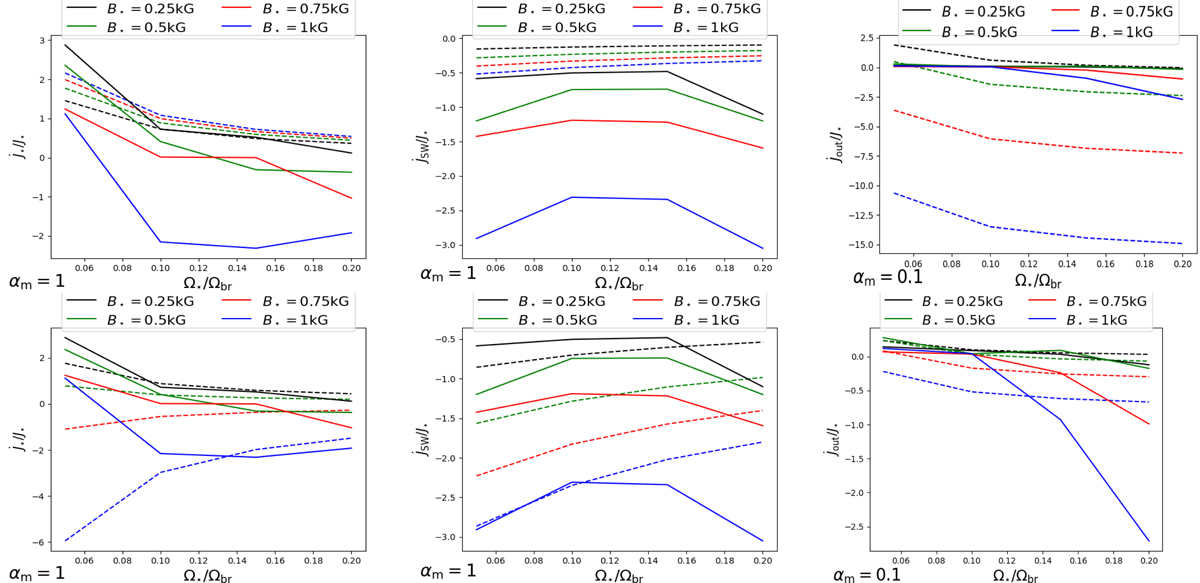
Fig. 16.
Download original image
Comparison of our results (shown in solid lines) with the results from Gallet et al. (2019; shown in dashed lines) expressed in our units of J⋆ (top). The line colors correspond to the same magnetic field strengths in both solid and dashed lines. In the leftmost panel, Kacc = 1 was set in Eq. (12), and K1 = 1.7 and K2 = 0.0506, m = 0.2177 in Eqs. (9) and (10). The results from our simulations differ from Gallet et al. (2019) predictions, in which they assumed those factors to be constant. In our simulations, those quantities are self-consistently adjusting. Examples of curves (bottom) for the same models by Gallet et al. (2019) as in the top panels (shown with the dashed lines) with the accretion factors Kacc, KME, and K1 modified in such a way to (at least in some of the solutions) better match the results from our simulations, shown with the solid lines. The text gives details on the modifications.
Current usage metrics show cumulative count of Article Views (full-text article views including HTML views, PDF and ePub downloads, according to the available data) and Abstracts Views on Vision4Press platform.
Data correspond to usage on the plateform after 2015. The current usage metrics is available 48-96 hours after online publication and is updated daily on week days.
Initial download of the metrics may take a while.