Fig. 2.
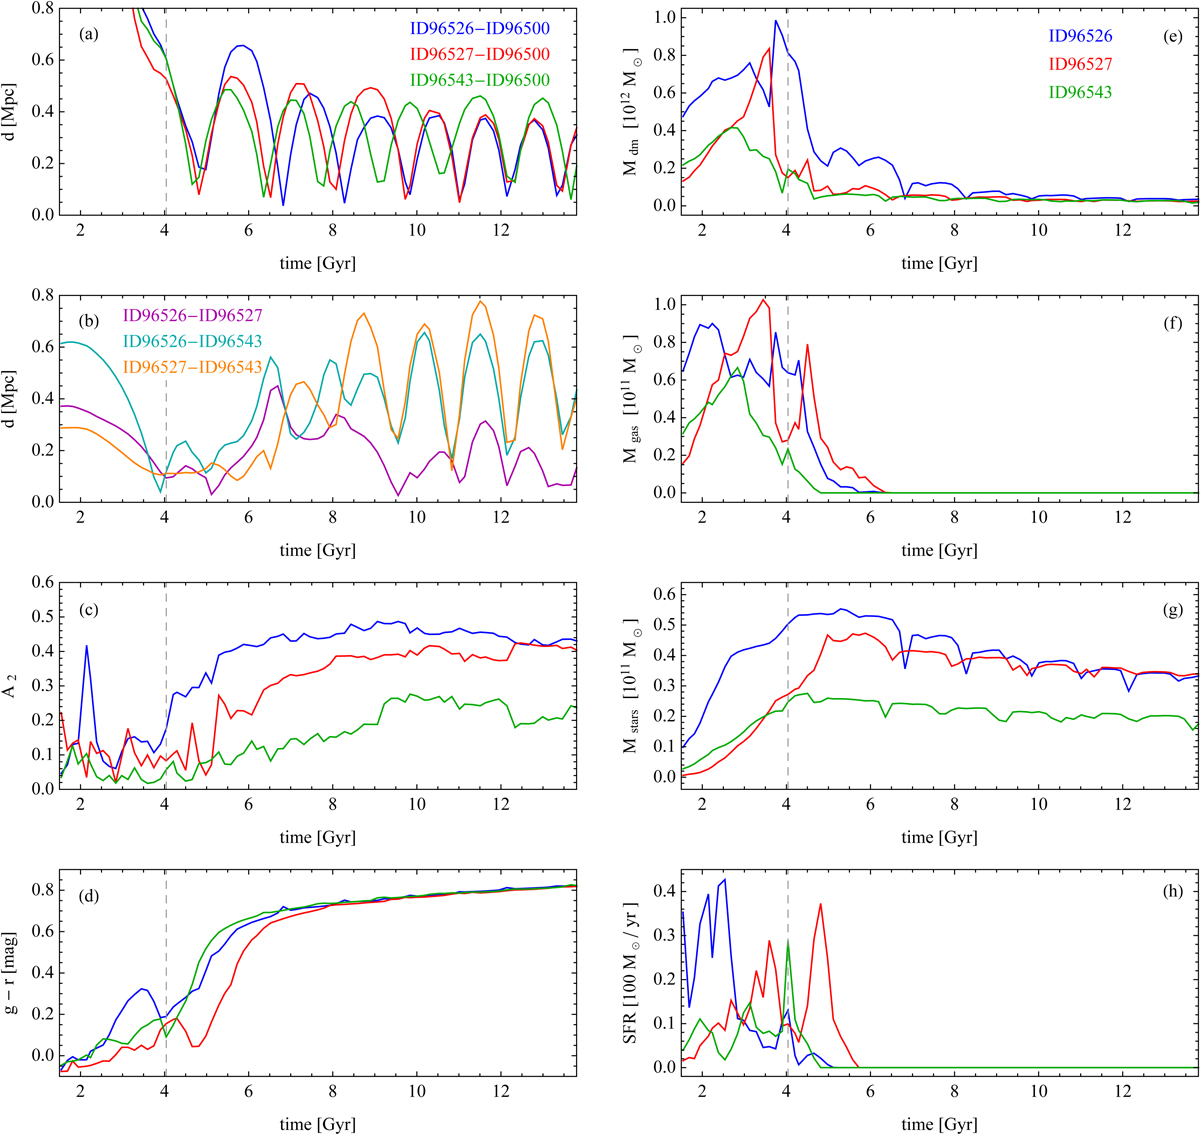
Download original image
Evolution of different properties of the three galaxies over time. Panels a and b illustrate the orbital history of the galaxies, with panel a showing the distance of each galaxy from the center of the forming cluster and panel b the distance between each pair of galaxies. Panels e–g show the evolution of the total mass of each galaxy in different components, dark matter, gas, and stars, respectively. Panel c presents the evolution of the bar mode A2 in each galaxy, measured within 2r1/2. Panels d and h show the evolution of the color and SFR in the galaxies. The color coding of the lines in panels c, d and f–h is the same as in panel e. The vertical dashed gray line in all panels indicates the time (t = 4 Gyr, z = 1.6) for which the images of the group are shown in Fig. 1.
Current usage metrics show cumulative count of Article Views (full-text article views including HTML views, PDF and ePub downloads, according to the available data) and Abstracts Views on Vision4Press platform.
Data correspond to usage on the plateform after 2015. The current usage metrics is available 48-96 hours after online publication and is updated daily on week days.
Initial download of the metrics may take a while.