Fig. 3
Download original image
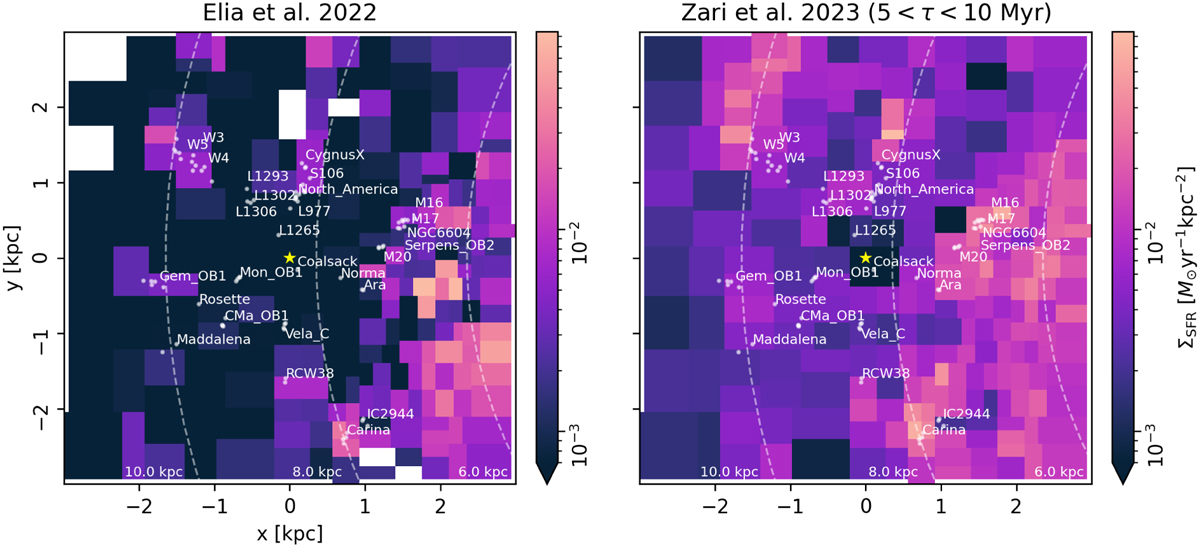
SFR surface density (∑SFR) obtained from the Hi-GAL clumps (left) and modeling of the high-mass stellar population (right) in a 6 kpc × 6 kpc area centered on the Sun (indicated with the yellow star). The labels give the positions of the sources in the “Handbook of Star-Forming Regions” (Reipurth 2008a,b) with the distances estimated in Zucker et al. (2020). The dashed lines correspond to galactocentric circles with the indicated radii.
Current usage metrics show cumulative count of Article Views (full-text article views including HTML views, PDF and ePub downloads, according to the available data) and Abstracts Views on Vision4Press platform.
Data correspond to usage on the plateform after 2015. The current usage metrics is available 48-96 hours after online publication and is updated daily on week days.
Initial download of the metrics may take a while.