Fig. 2
Download original image
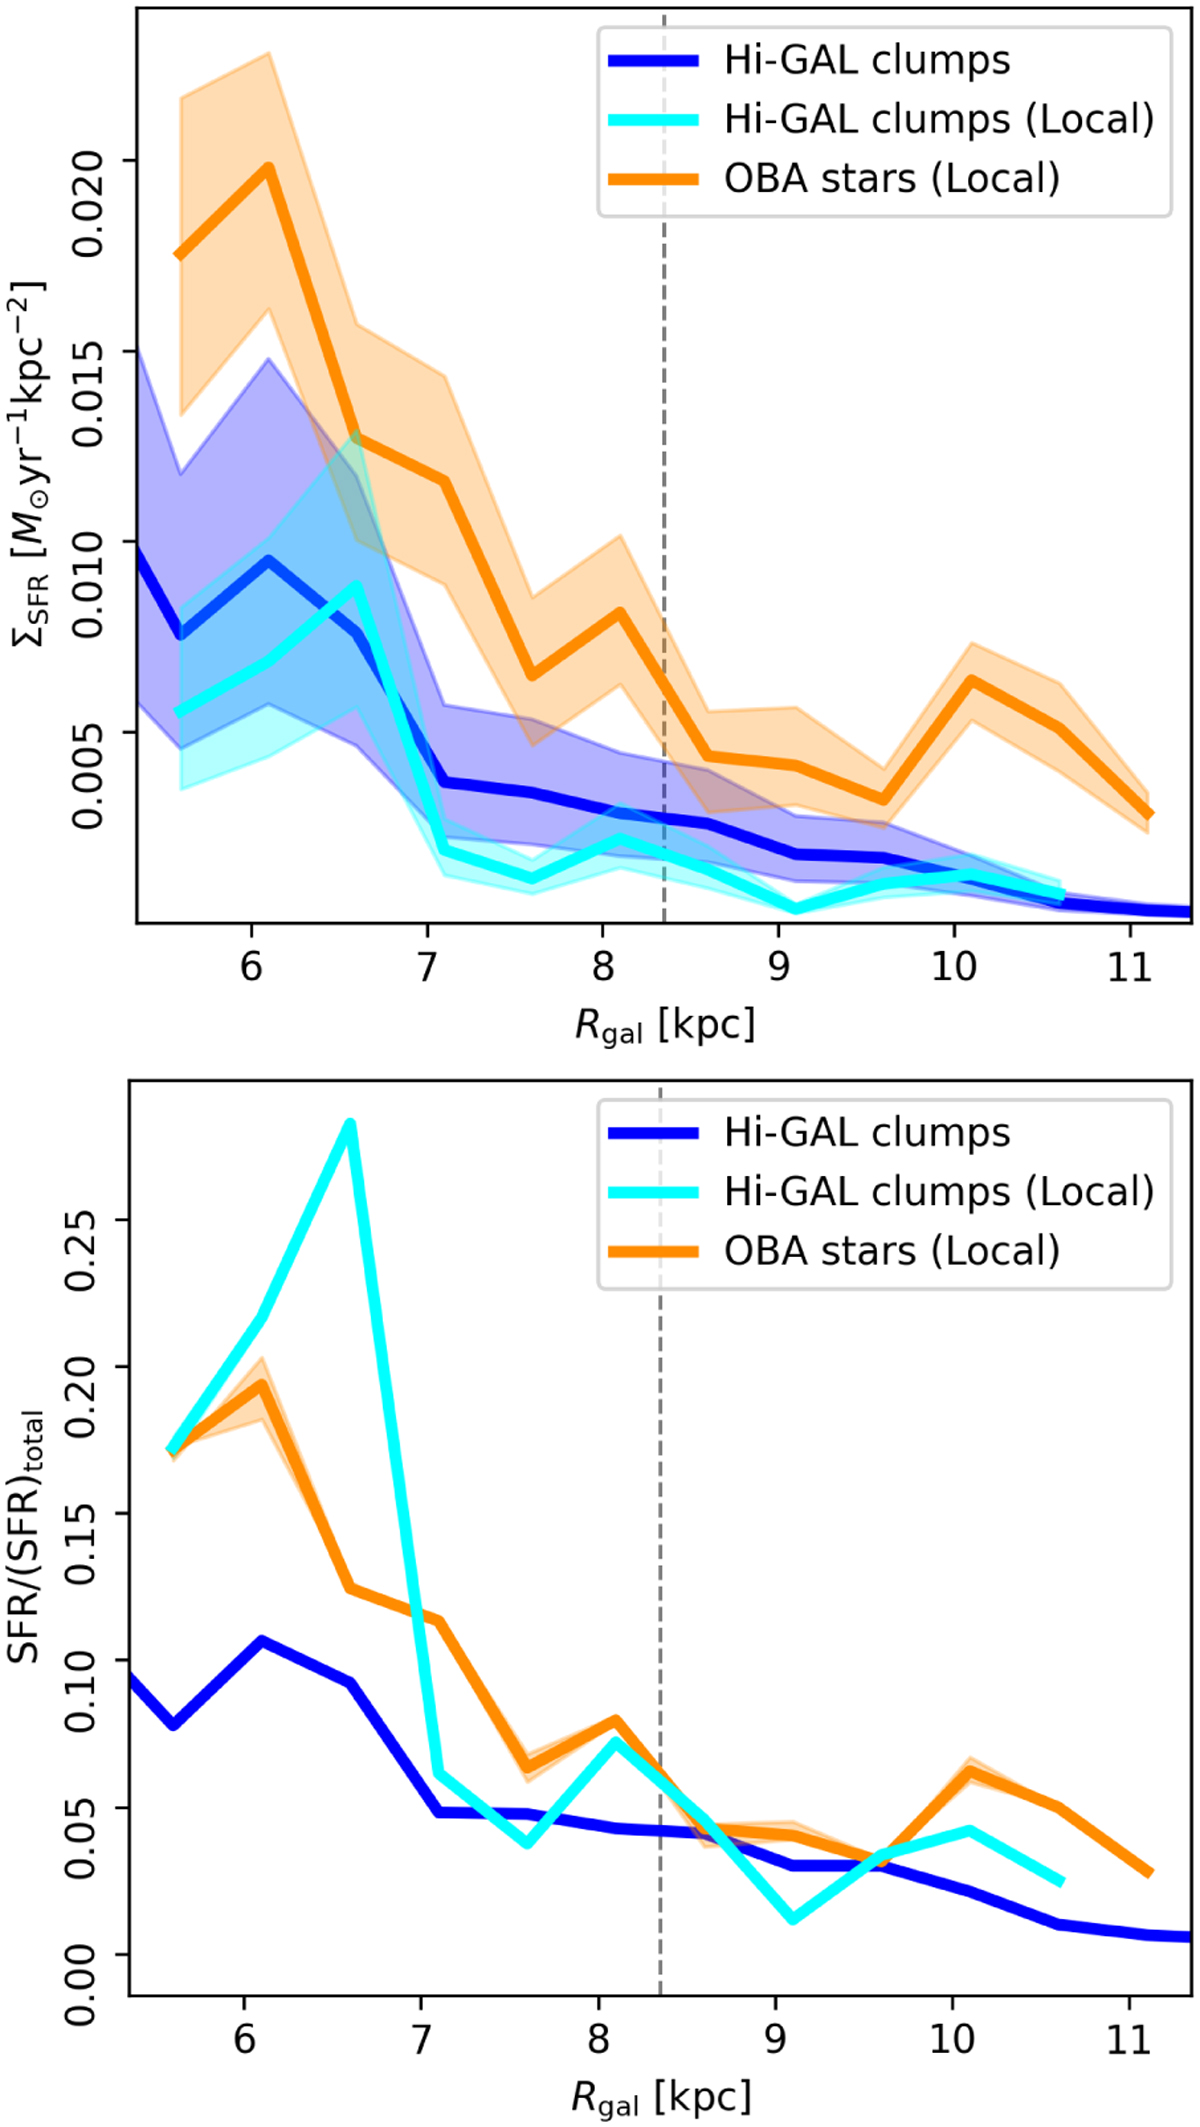
Profiles of the star formation surface density (∑SFR ; top) and normalized star formation (SFR/SFRtotal, where ![]() ; bottom) obtained from modeling of the populations of high-mass stars in the age interval 5 <τ< 10Myr (orange; Zari et al. 2023) and the FIR emission from the Hi-GAL clumps (blue and cyan; Elia et al. 2022). The orange and cyan curves, labeled “local,” correspond to the profiles derived from an area of 6 kpc × 6 kpc around the Sun. The blue lines correspond to the profile from the full azimuthal range. The vertical segmented line indicates the assumed position of the Sun. The shaded areas indicate the 16th and 84th percentiles in the Zari et al. (2023) estimates and the upper and lower limits given by Eq. (1) in the E22 estimates.
; bottom) obtained from modeling of the populations of high-mass stars in the age interval 5 <τ< 10Myr (orange; Zari et al. 2023) and the FIR emission from the Hi-GAL clumps (blue and cyan; Elia et al. 2022). The orange and cyan curves, labeled “local,” correspond to the profiles derived from an area of 6 kpc × 6 kpc around the Sun. The blue lines correspond to the profile from the full azimuthal range. The vertical segmented line indicates the assumed position of the Sun. The shaded areas indicate the 16th and 84th percentiles in the Zari et al. (2023) estimates and the upper and lower limits given by Eq. (1) in the E22 estimates.
Current usage metrics show cumulative count of Article Views (full-text article views including HTML views, PDF and ePub downloads, according to the available data) and Abstracts Views on Vision4Press platform.
Data correspond to usage on the plateform after 2015. The current usage metrics is available 48-96 hours after online publication and is updated daily on week days.
Initial download of the metrics may take a while.