Fig. 8
Download original image
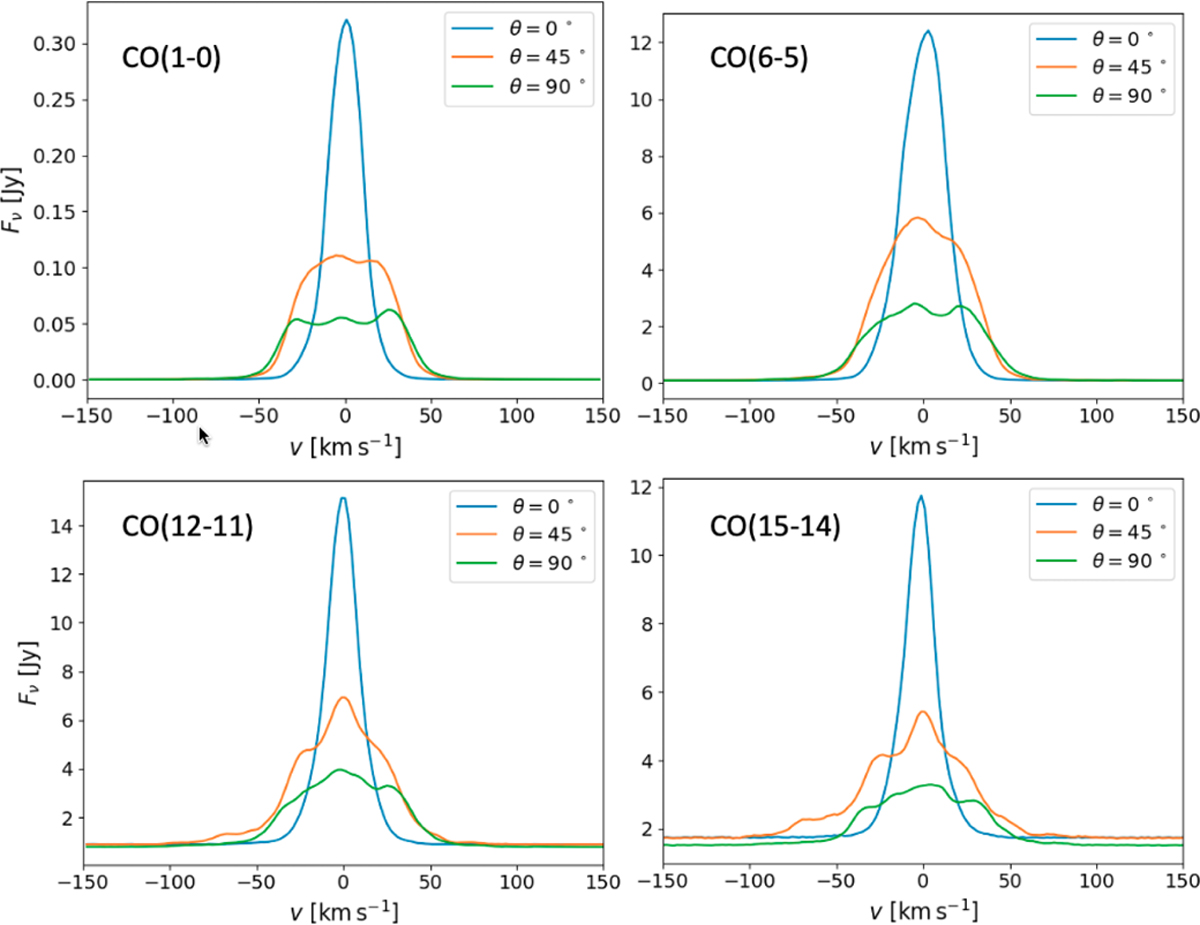
Integrated line profile of the CO(1–0), CO(6–5), CO (12–11), and CO(15–14) transitions for the AGN torus simulation. The lines correspond to line profiles seen at different inclination angles, as the legend indicates. υ = 0 km s−1 corresponds the rest wavelength of each line transition. The line profiles are observed by observers located at a fiducial distance of 4.2 Mpc with a beam size of (32 pc)2.
Current usage metrics show cumulative count of Article Views (full-text article views including HTML views, PDF and ePub downloads, according to the available data) and Abstracts Views on Vision4Press platform.
Data correspond to usage on the plateform after 2015. The current usage metrics is available 48-96 hours after online publication and is updated daily on week days.
Initial download of the metrics may take a while.