Fig. 3
Download original image
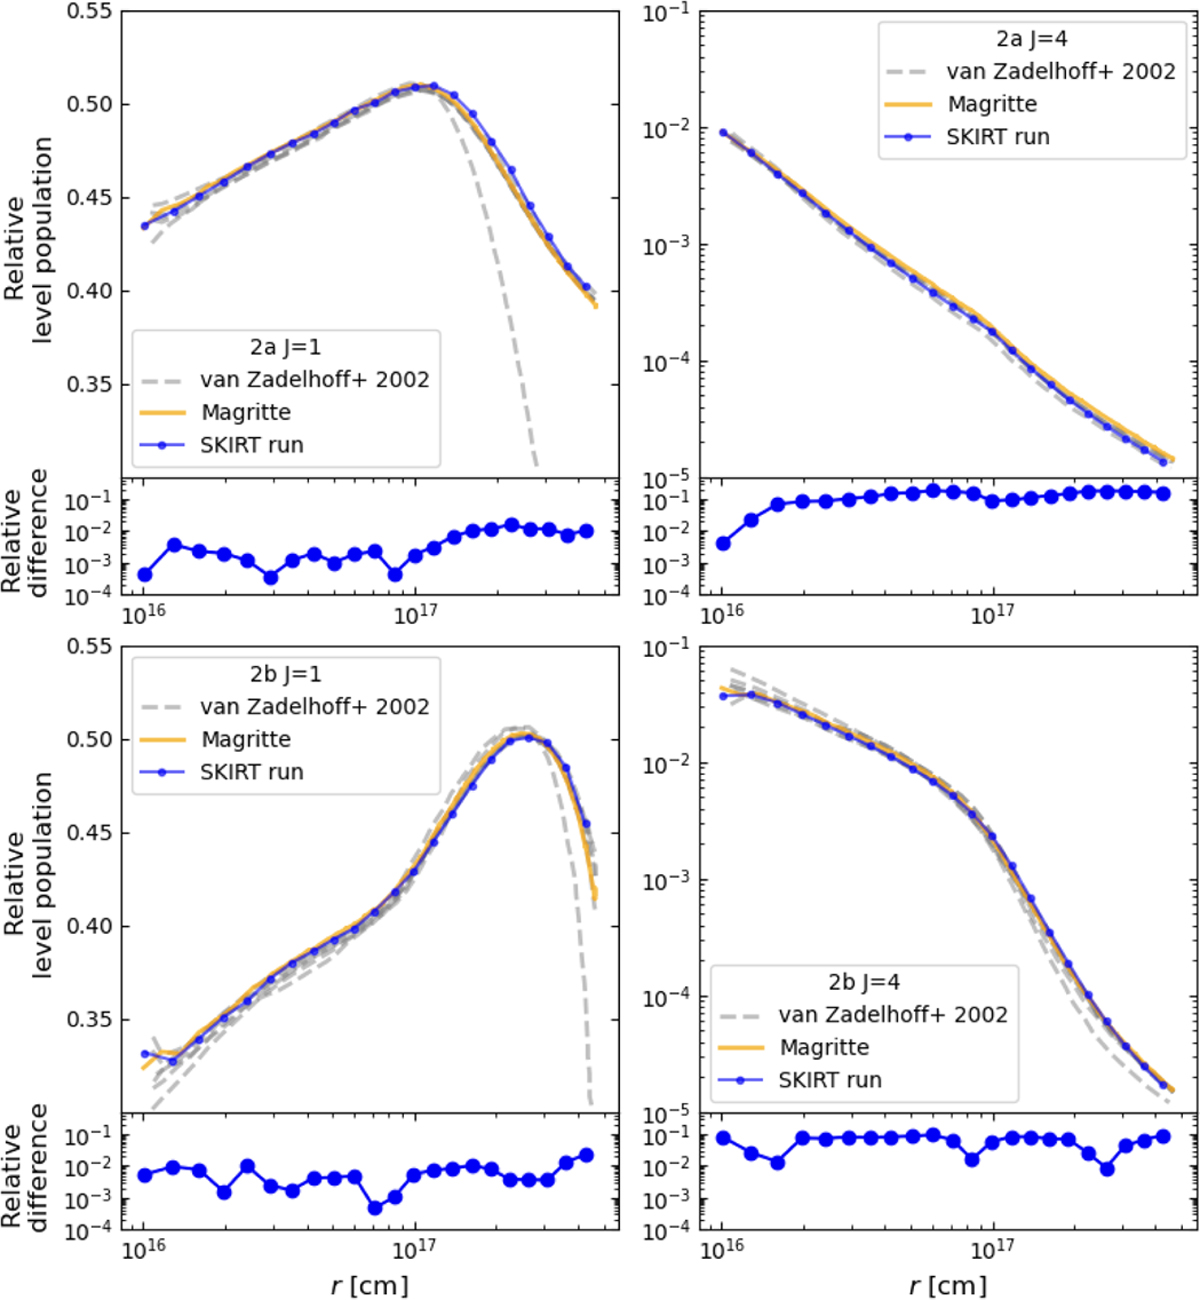
Comparison of the relative HCO+ level population for benchmark problem 2a (upper panels) and 2b (bottom panels) at J = 1 (left) and J = 4 (right) obtained with SKIRT (blue solid lines with dots) and MAGRITTE (yellow solid lines) and the reference results of van Zadelhoff et al. (2002; gray dashed lines). The level population is normalized by the total number density. The relative differences between the MAGRITTE and SKIRT results are shown in the lower subpanels.
Current usage metrics show cumulative count of Article Views (full-text article views including HTML views, PDF and ePub downloads, according to the available data) and Abstracts Views on Vision4Press platform.
Data correspond to usage on the plateform after 2015. The current usage metrics is available 48-96 hours after online publication and is updated daily on week days.
Initial download of the metrics may take a while.