Open Access
Fig. 17
Download original image
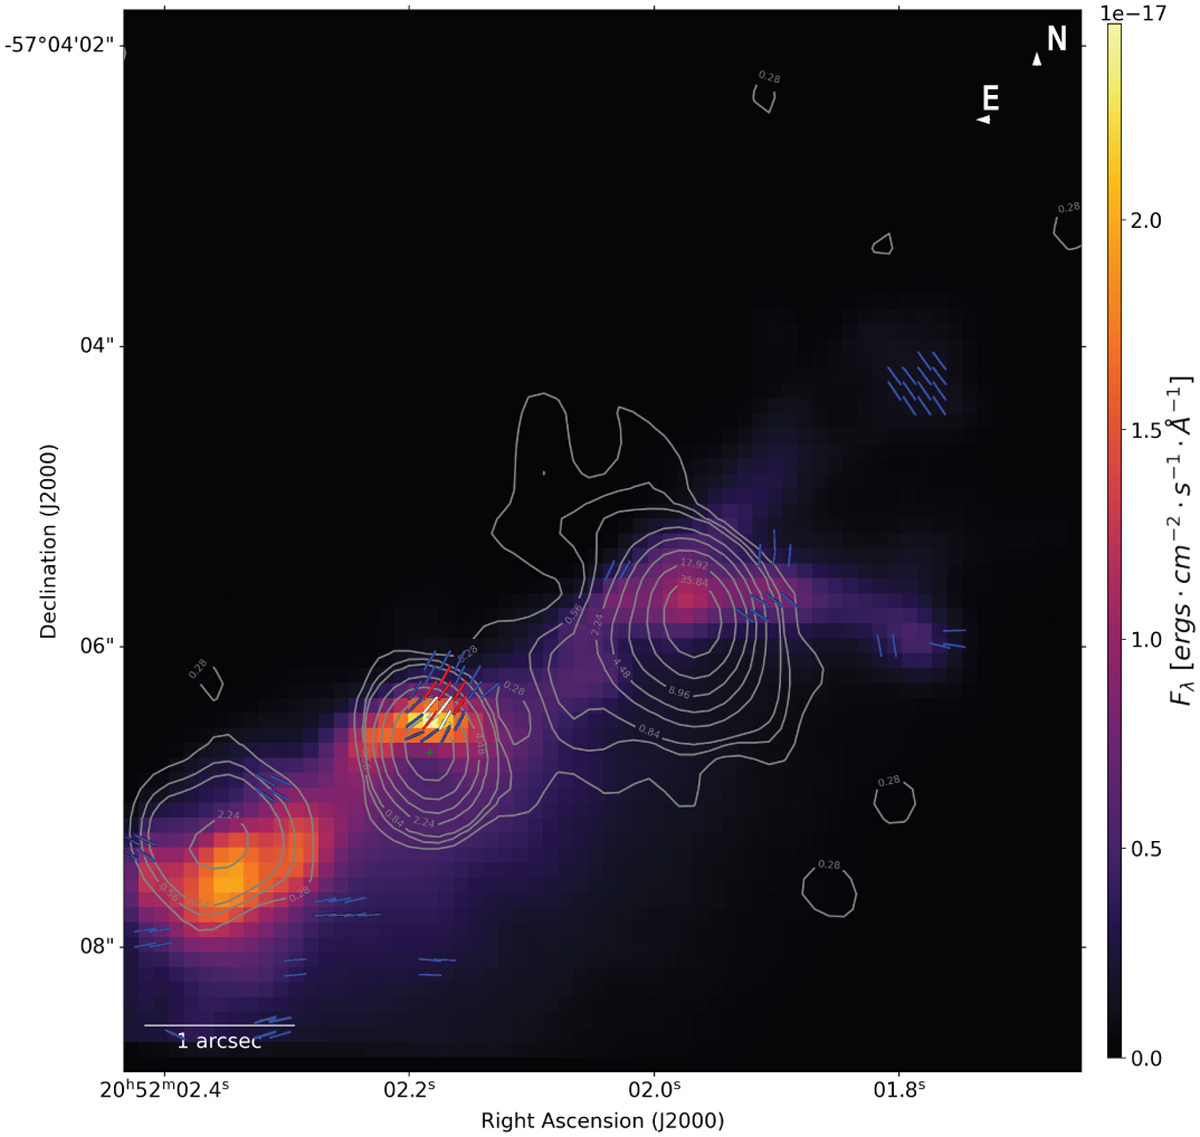
18 GHz ATCA map from Morganti et al. (1998) superimposed onto our HST/FOC map. Both maps have been aligned on the supposed nucleus location. The optical polarization vector have a fixed length to better highlight their orientation.
Current usage metrics show cumulative count of Article Views (full-text article views including HTML views, PDF and ePub downloads, according to the available data) and Abstracts Views on Vision4Press platform.
Data correspond to usage on the plateform after 2015. The current usage metrics is available 48-96 hours after online publication and is updated daily on week days.
Initial download of the metrics may take a while.