Open Access
Fig. 16
Download original image
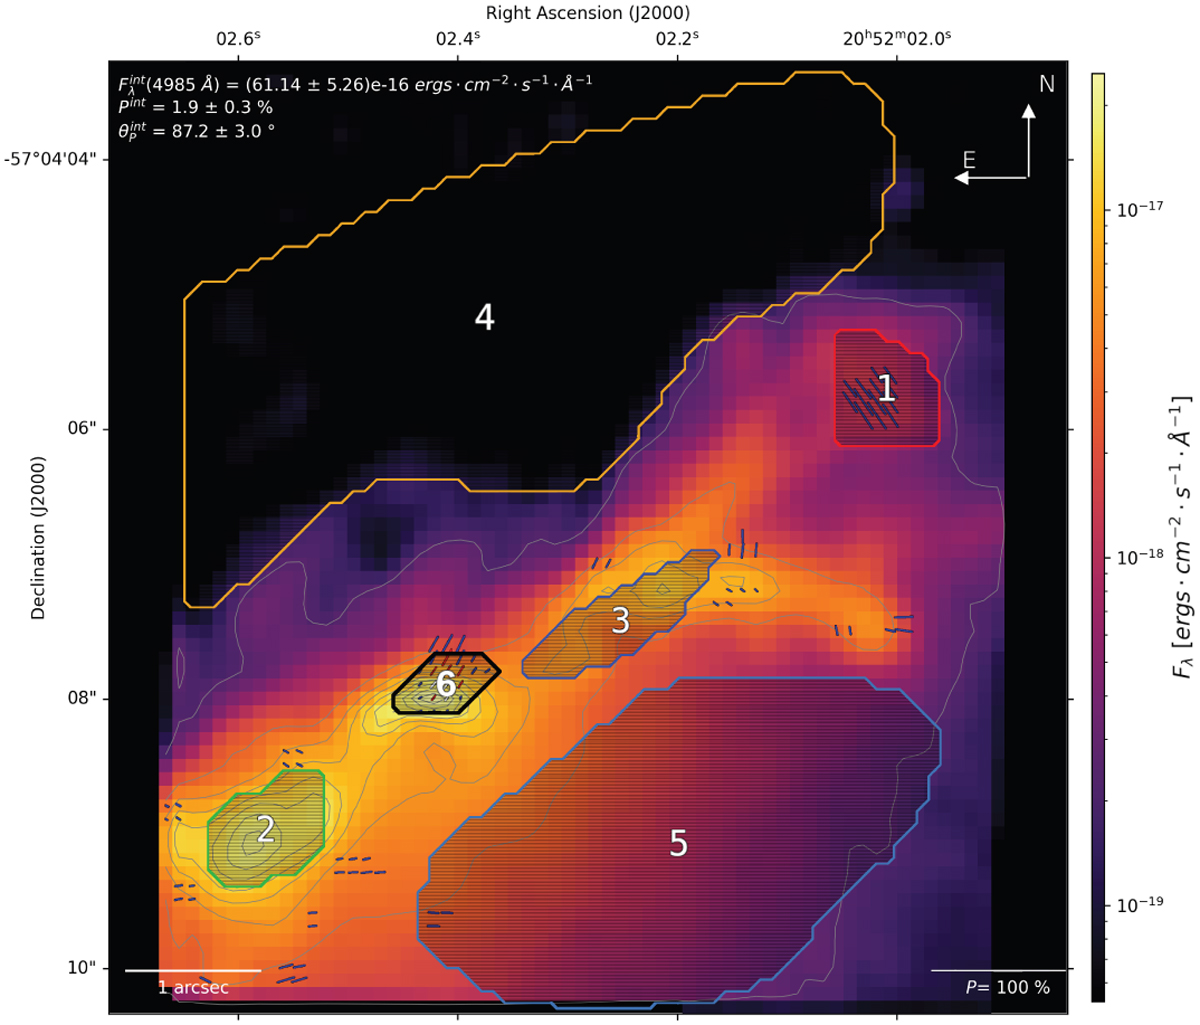
Optical polarization map for IC 5063 obtained through the pipeline. The polarization vectors are displayed for [S/N]I ≥ 30 and [S/N]P ≥ 3 in white, for [S/N]P ≥ 2 in red and for [S/N]P ≥ 1 in blue and the overlaid regions are listed in Table 2 and detailed in the text.
Current usage metrics show cumulative count of Article Views (full-text article views including HTML views, PDF and ePub downloads, according to the available data) and Abstracts Views on Vision4Press platform.
Data correspond to usage on the plateform after 2015. The current usage metrics is available 48-96 hours after online publication and is updated daily on week days.
Initial download of the metrics may take a while.