Fig. 15
Download original image
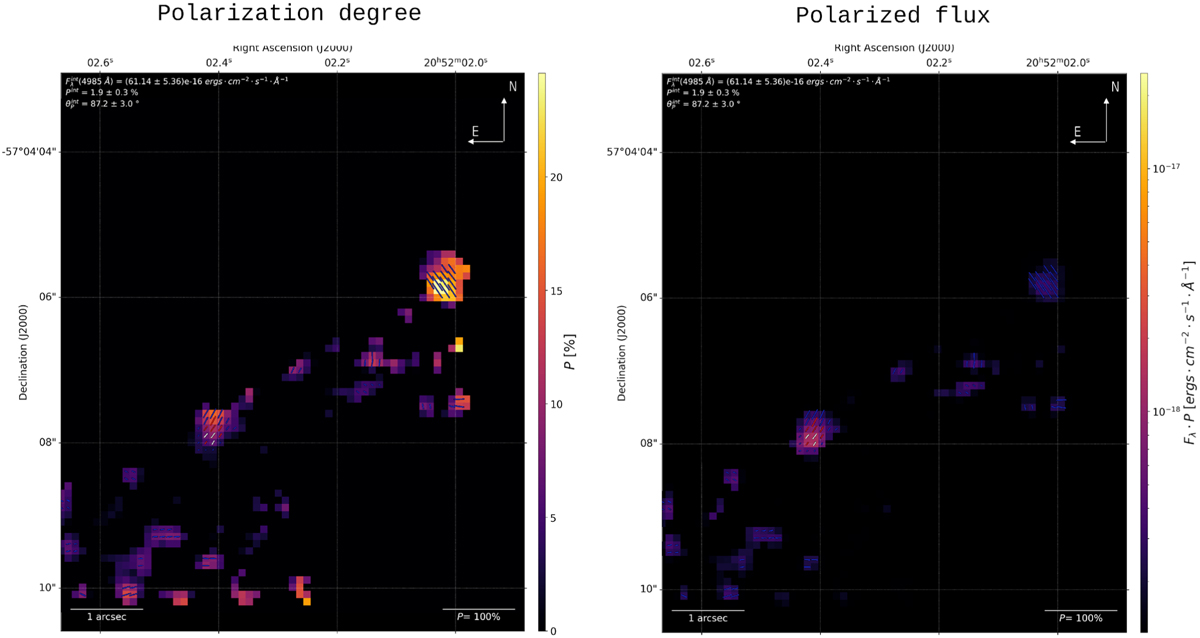
Two different outputs of the pipeline for IC 5063 with the polarization map superimposed. The polarization vectors are only displayed for the selected cut of [S/N]I ≥ 30 and [S/N]P ≥ 3 in white, for [S/N]P ≥ 2 in red and for [S/N]P ≥ 1 in blue. The integrated values are computed on the full FoV (Pint and ![]() ). Left: polarization degree P (%). Right: polarized flux Fλ · P (erg s−1 cm−2 Å−1).
). Left: polarization degree P (%). Right: polarized flux Fλ · P (erg s−1 cm−2 Å−1).
Current usage metrics show cumulative count of Article Views (full-text article views including HTML views, PDF and ePub downloads, according to the available data) and Abstracts Views on Vision4Press platform.
Data correspond to usage on the plateform after 2015. The current usage metrics is available 48-96 hours after online publication and is updated daily on week days.
Initial download of the metrics may take a while.