Fig. C.1.
Download original image
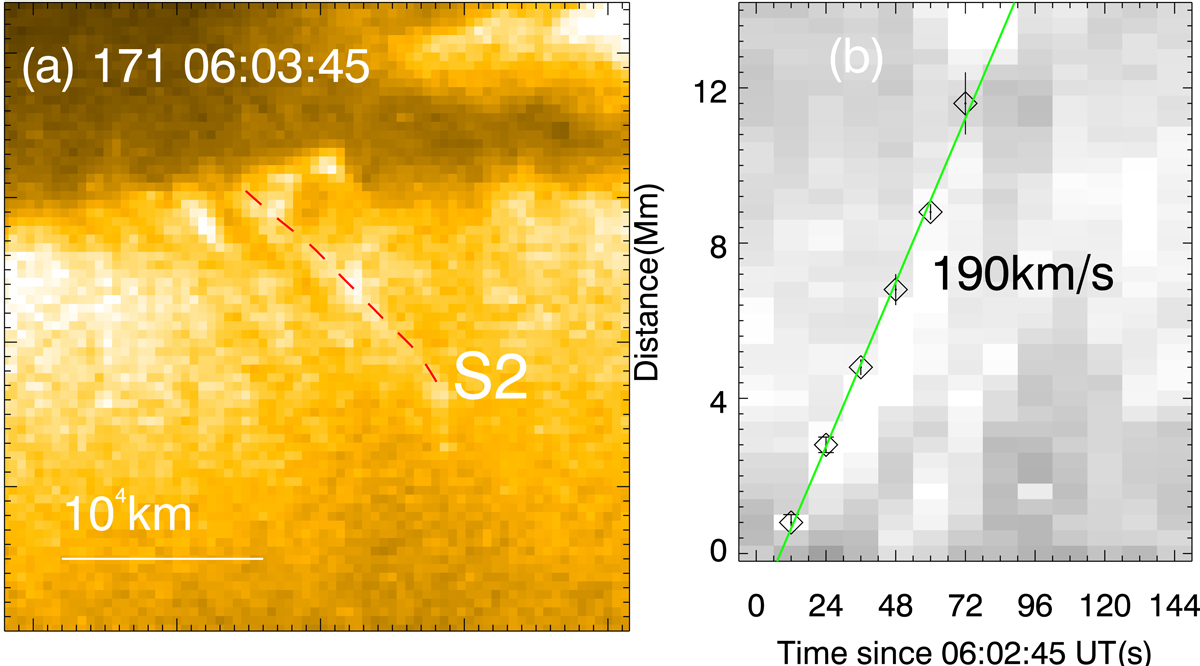
Dynamics of the jet in the observations of AIA 171 Å passband. (a): Region of the jet at the time when the jet is contacting the coronal plumes on 06:03:45 UT. The trajectory of the upstream of the jet flows is outlined by the dashed line in red (S2). (b): Time-distance map for the jet along the cut of S2. The propagation of the jet flows appears as bright streaks on this map. The diamond symbols (with error bars) mark the largest gradients at the boundary of the a bright streak at the corresponding times to follow the propagation of a stream of the flows. The speed of the stream is then derived from the slope of the linear fitting to the diamond symbols (green line) and given as 190 km s−1.
Current usage metrics show cumulative count of Article Views (full-text article views including HTML views, PDF and ePub downloads, according to the available data) and Abstracts Views on Vision4Press platform.
Data correspond to usage on the plateform after 2015. The current usage metrics is available 48-96 hours after online publication and is updated daily on week days.
Initial download of the metrics may take a while.