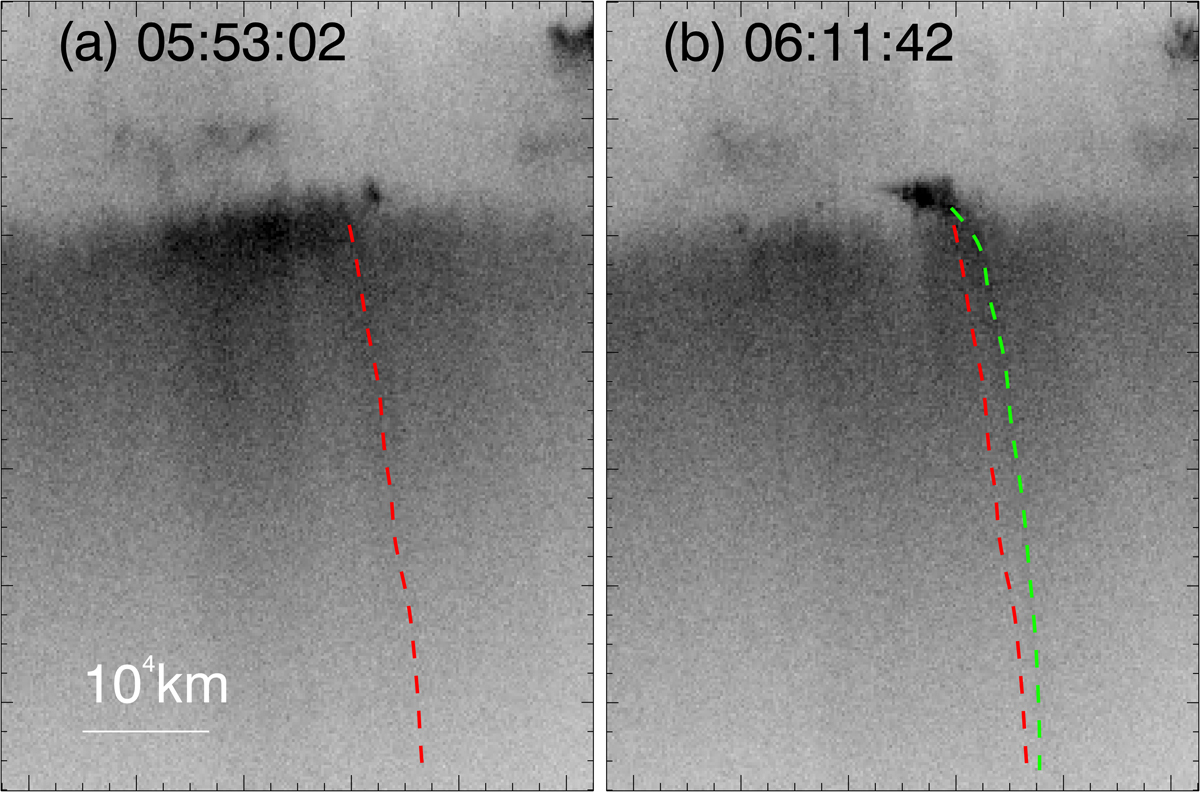
Fig. B.2.
Download original image
Evolution of the region where the jet takes place in EUI 174 Å images showing with an inversed-color table. (a): Region seen at 05:53:02 UT (before occurrence of the jet). The extension of the coronal plumes about to contact the jet flow is outlined by the dashed line in red. (b): Region at 06:11:42 UT (after occurrence of the jet). The extension of the coronal plumes at this time is outlined by the dashed line in green. The change of the coronal plumes due to the interaction of the jet can be seen from the their extension at 05:53:02 UT (red line) and that at 06:11:42 UT (green line).
Current usage metrics show cumulative count of Article Views (full-text article views including HTML views, PDF and ePub downloads, according to the available data) and Abstracts Views on Vision4Press platform.
Data correspond to usage on the plateform after 2015. The current usage metrics is available 48-96 hours after online publication and is updated daily on week days.
Initial download of the metrics may take a while.