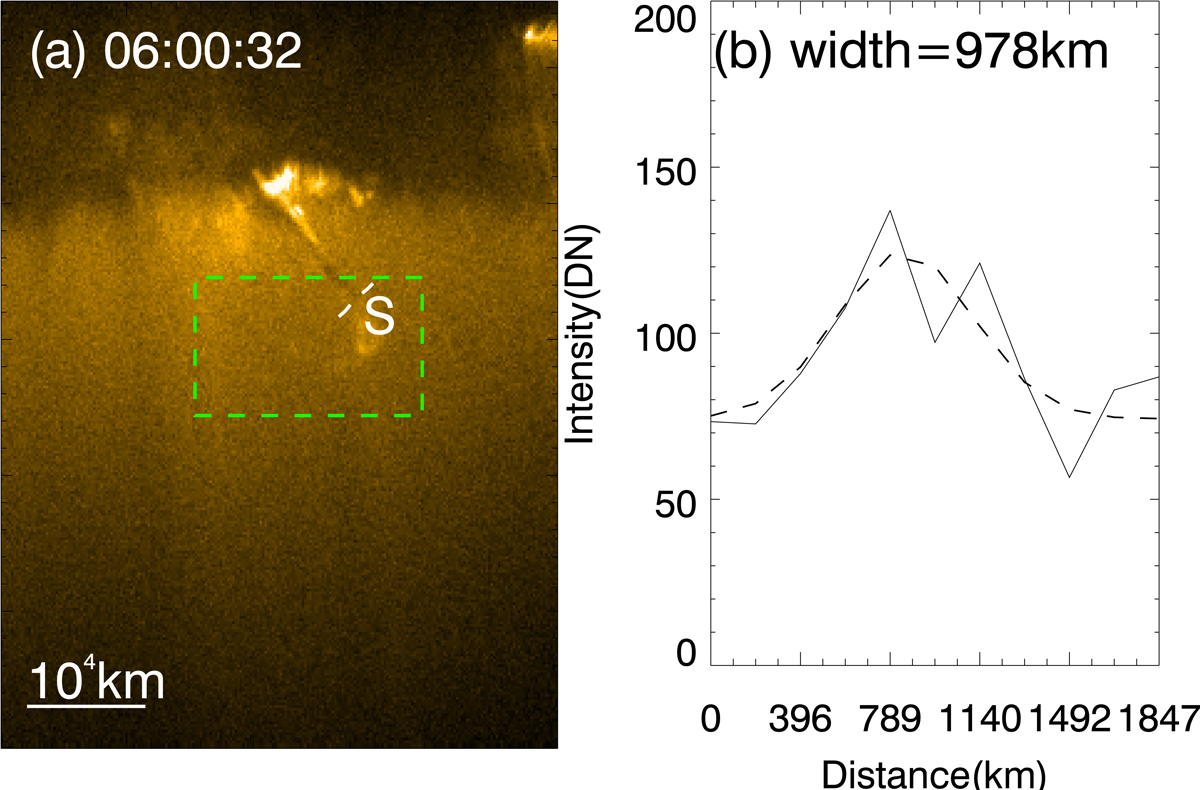
Fig. 2.
Download original image
Measurement of the width of the jet at the location in the upstream near the turning point where the jet contacts the coronal plume. (a): region of the jet at the time when the jet comes into contact with the coronal plume on 06:00:32 UT in the EUI 174 Å image. The square (green dashed lines) encloses the region that is shown in Fig. 5. The dashed line in white (‘S’) marks the location in the upstream of the jet near the turning point, from which the intensity distribution is obtained and shown in panel b. (b): intensity distribution (with a base of 800) along the cut of ‘S’. The profile of the distribution is obtained through a Gaussian fit, and the width of the jet is the full width at half maximum of the Gaussian fit and given as 978 km.
Current usage metrics show cumulative count of Article Views (full-text article views including HTML views, PDF and ePub downloads, according to the available data) and Abstracts Views on Vision4Press platform.
Data correspond to usage on the plateform after 2015. The current usage metrics is available 48-96 hours after online publication and is updated daily on week days.
Initial download of the metrics may take a while.