Fig. C.4.
Download original image
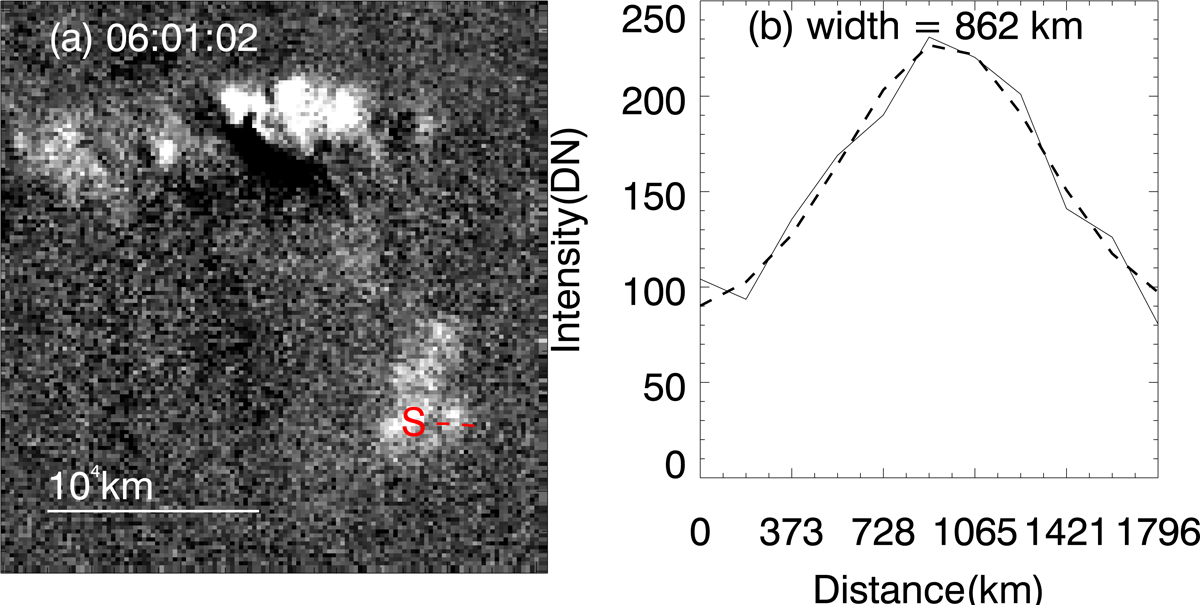
Measurement of the width of a vortex froming in the jet flow. (a): Different image between observation at 06:01:02 UT and that at 05:58:52 UT, in which the bright blob structure (vortex) is better seen. The dashed line in red (‘S’) cuts through a bright blob, from which the intensity distribution is obtained and shown in panel b. (b): Intensity distribution along the cut of S. The profile of the distribution is obtained through a Gaussian fit, and the width of the jet is determined to be the full width at half maximum of the Gaussian fit and given as 862 km.
Current usage metrics show cumulative count of Article Views (full-text article views including HTML views, PDF and ePub downloads, according to the available data) and Abstracts Views on Vision4Press platform.
Data correspond to usage on the plateform after 2015. The current usage metrics is available 48-96 hours after online publication and is updated daily on week days.
Initial download of the metrics may take a while.