Fig. 1.
Download original image
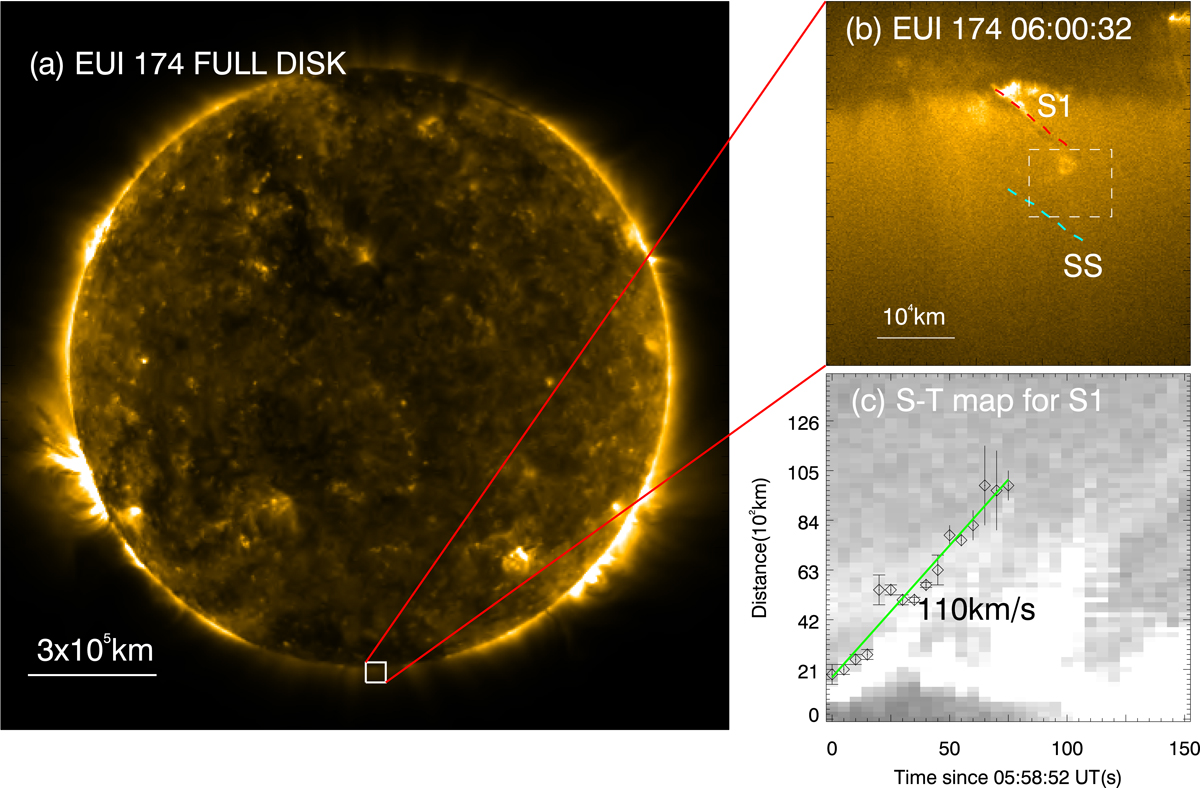
Overview of the studied jet as seen by EUI at the extreme ultraviolet passband of 174 Å. (a): full disk of the Sun at 10:25 UT. The jet occurs in the region in the south pole as enclosed by the white square. (b): region of the jet at the time when the jet just contacts the coronal plumes. The trajectory of the upstream of the jet flows is outlined by dashed line in red (S1), and a bright feature can be observed at the top of the jet where the interaction between the jet and the coronal plumes takes place. The square (white dashed lines) encloses the region that is shown in Figs. 4a–f. The dashed line in cyan (SS) marks the location at the downstream of the jet flows from which the variation of radiation is obtained and shown in Fig. 4g. (c): time–distance map of the jet along the cut of S1. The propagation of the jet flows appears as bright streaks on this map. The diamond symbols (with error bars), which mark the largest gradients at the boundary of a bright streak at the corresponding times, follow the propagation of a stream of the flows. The speed of the stream is then derived from the slope of the linear fitting to the diamond symbols (green line) and given as about 110 km s−1.
Current usage metrics show cumulative count of Article Views (full-text article views including HTML views, PDF and ePub downloads, according to the available data) and Abstracts Views on Vision4Press platform.
Data correspond to usage on the plateform after 2015. The current usage metrics is available 48-96 hours after online publication and is updated daily on week days.
Initial download of the metrics may take a while.