Fig. B.1

Download original image
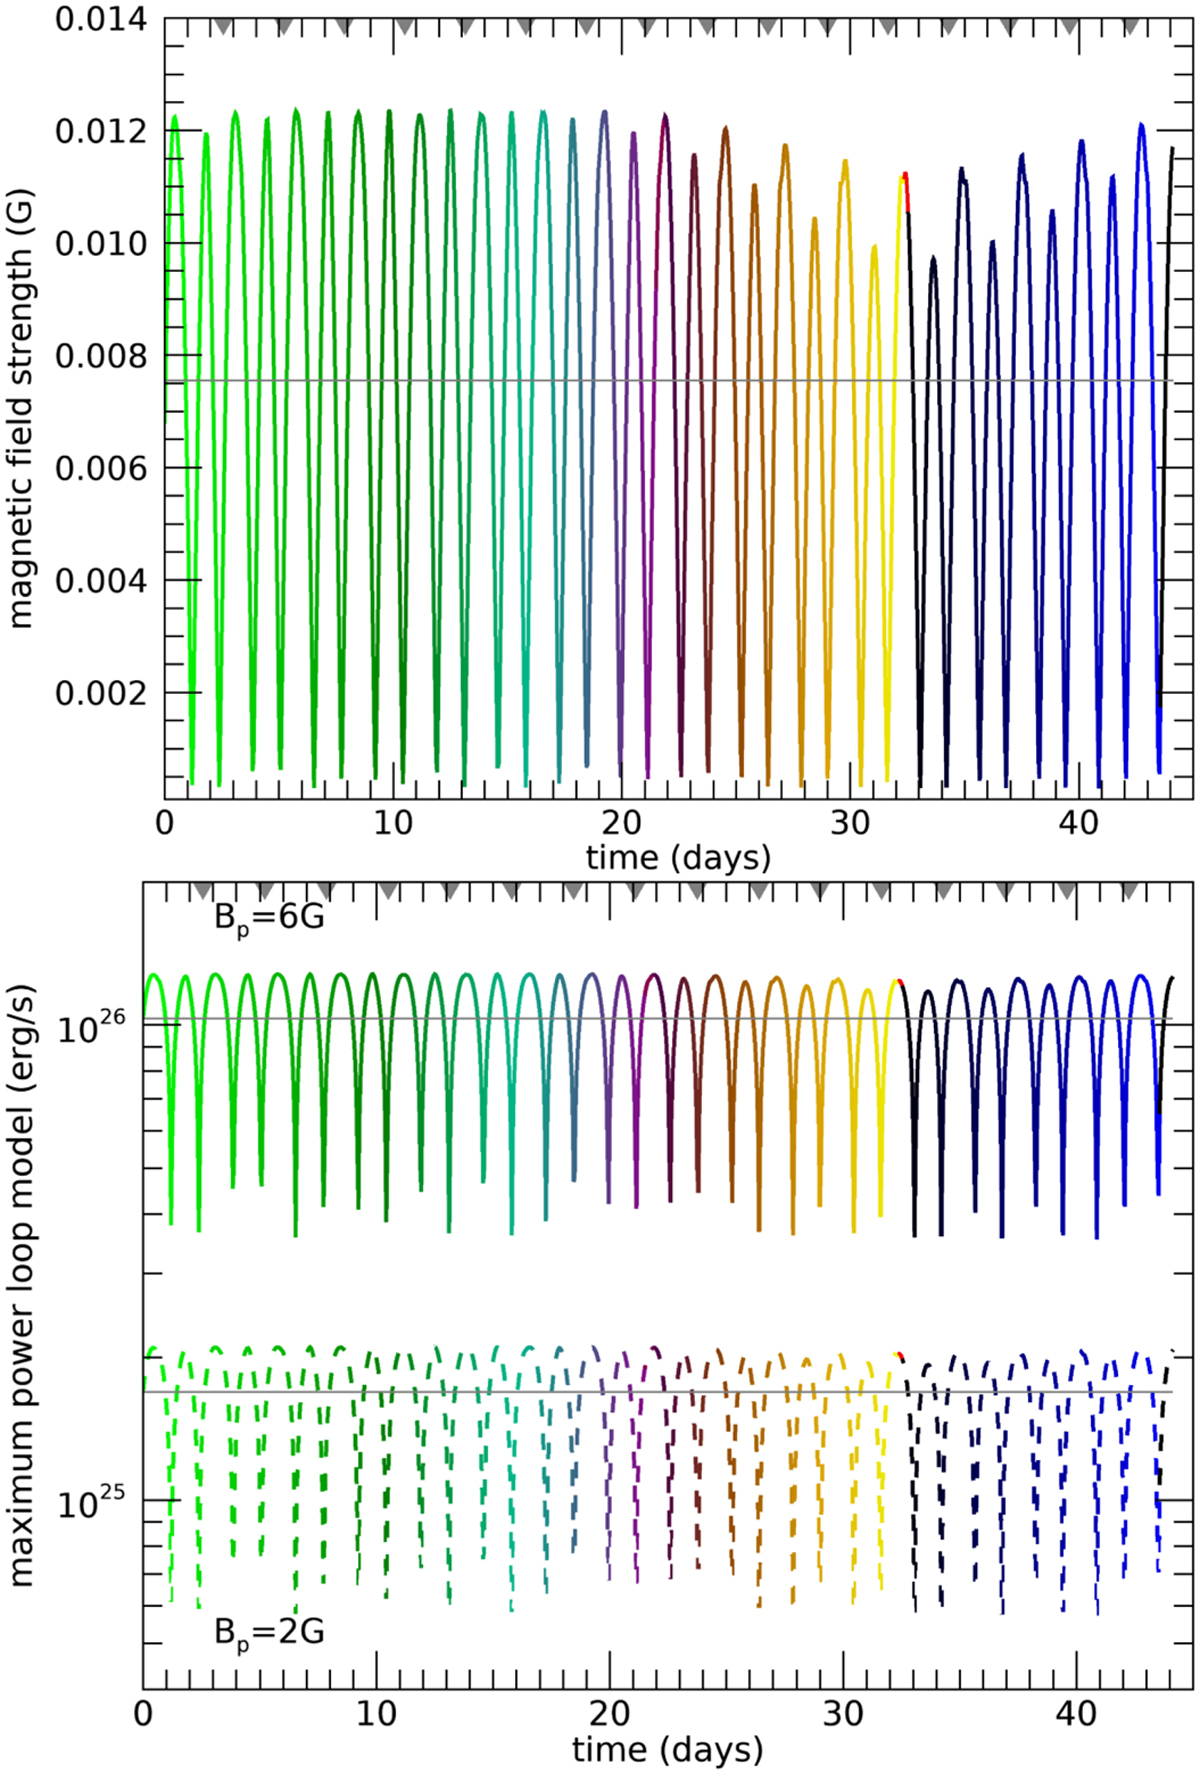
Interconnecting loop model. Top: Magnetic field of the star at the orbital distance of the planet, assuming a potential field extrapolation, with a source surface of ≃ 15R⋆ (in this case, no wind model is used). Bottom: Maximum dissipated power in the interconnecting loop model, assuming a polar planetary magnetic field strength (dipole) of 2 G (dashed) and 6 G (solid). The colour scheme follows the colour bar shown in Fig. 3. The grey arrows in the upper horizontal axes indicate approximate times of mid-transits.
Current usage metrics show cumulative count of Article Views (full-text article views including HTML views, PDF and ePub downloads, according to the available data) and Abstracts Views on Vision4Press platform.
Data correspond to usage on the plateform after 2015. The current usage metrics is available 48-96 hours after online publication and is updated daily on week days.
Initial download of the metrics may take a while.


