Fig. 4
Download original image
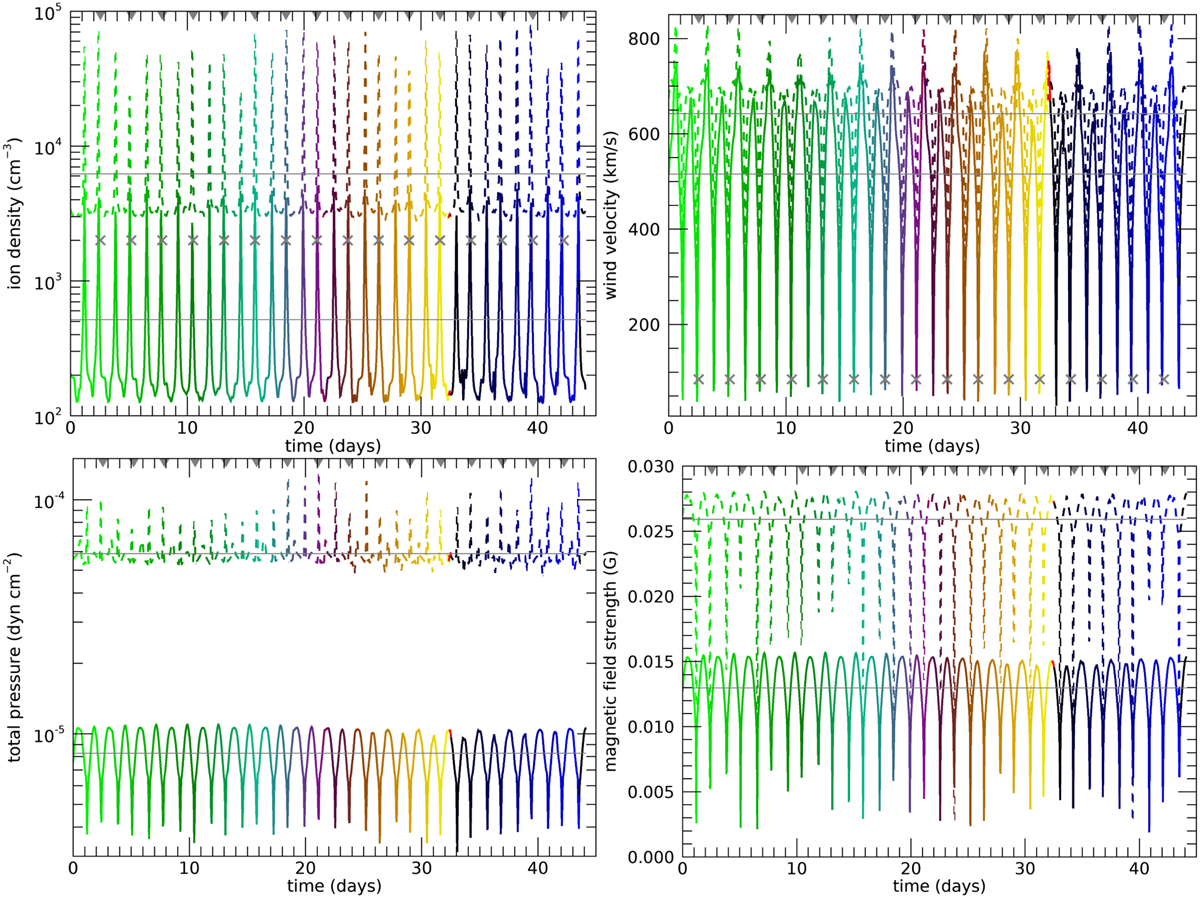
Stellar wind proton density, velocity, total pressure (sum of ram, including the planet‘s own orbital motion and the thermal and magnetic pressures), and total magnetic field strength at the orbit of GJ 436b. The solid lines are for Model I and the dashed lines for Model II. Colour represents the time evolution and follows the colour scheme shown in Fig. 3. The horizontal grey lines are the time average of the stellar wind properties over one stellar rotation period (about 16 orbital periods of the planet). The grey arrows in the upper horizontal axes indicate approximate times of mid-transits. In the upper panels, the crosses indicate the wind values derived in the work of Bourrier et al. (2016), and they are plotted at the mid-transit times. Note how they overlap really well with the values derived in our Model I, indicating that Model I provides a better description of the wind of GJ 436.
Current usage metrics show cumulative count of Article Views (full-text article views including HTML views, PDF and ePub downloads, according to the available data) and Abstracts Views on Vision4Press platform.
Data correspond to usage on the plateform after 2015. The current usage metrics is available 48-96 hours after online publication and is updated daily on week days.
Initial download of the metrics may take a while.