Fig. 2

Download original image
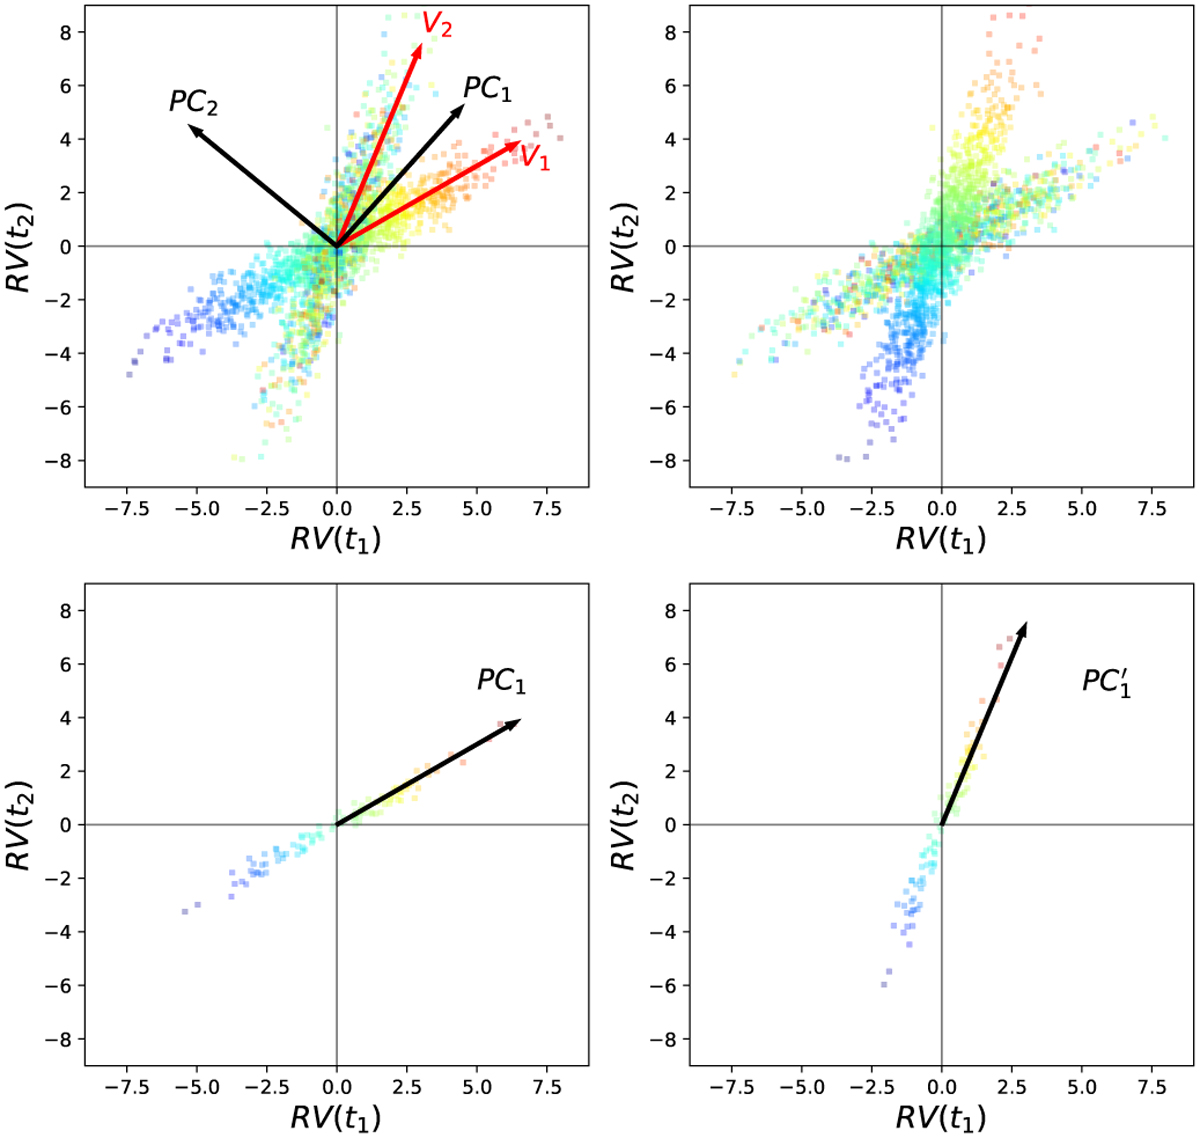
Same as Fig. 1 for a mixture of two systematic effects sharing some partial correlation. The individual LBL RVs are shown in the top row, coloured according to wavelength (left) or y-pixel position (right). The two systematic effects V1 and V2 (shown by the red arrows in the top left panel) depend, respectively on these two variables. A classical PCA decomposition results in orthogonal components PC1 and PC2 (as shown by the arrows in the top left panel), that are unrelated to the main systematics effects. In the bottom row, we first group-average the LBL RVs according to wavelength (left) and y-position (right) before performing PCA on the result to identify principal components PC1 and PC′1that are proportional to V1 and V2, respectively. The same would occur for a cloud of data with outliers.
Current usage metrics show cumulative count of Article Views (full-text article views including HTML views, PDF and ePub downloads, according to the available data) and Abstracts Views on Vision4Press platform.
Data correspond to usage on the plateform after 2015. The current usage metrics is available 48-96 hours after online publication and is updated daily on week days.
Initial download of the metrics may take a while.


