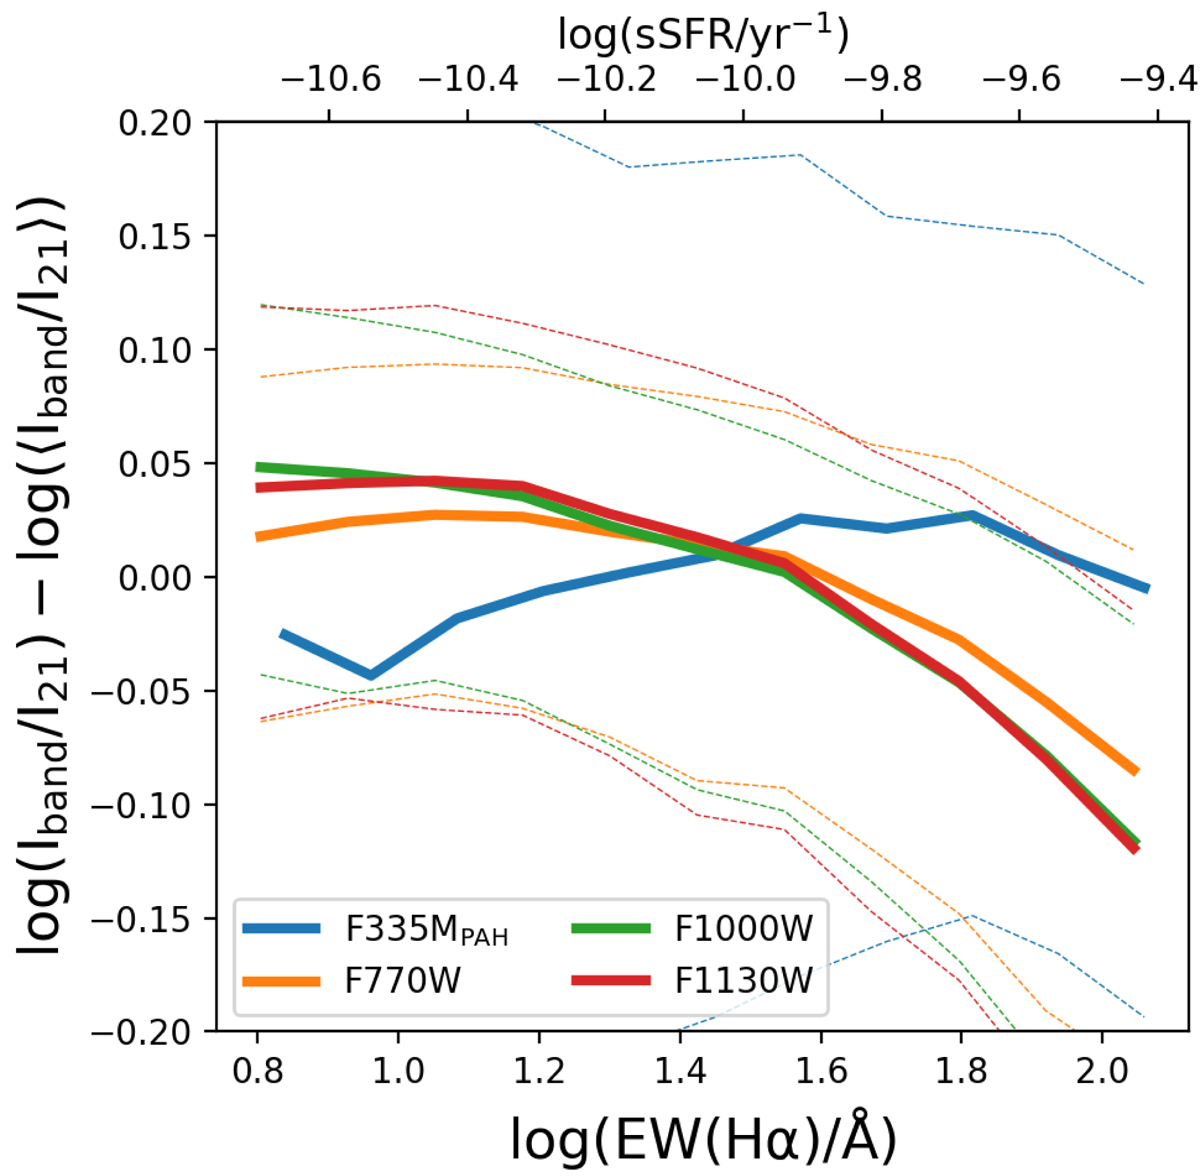
Fig. 7.
Download original image
Ratio of Iband/I21 normalised to the sample mean (⟨Iband/I21⟩) as a function of EW(Hα), for band = [F335MPAH (blue), F770W (orange), F1000W (green), F1130W (red)]. The solid lines represent the median, while the dashed lines correspond to the 16th and 84th percentiles. The alternative x-axis on top shows the sSFR associated with each EW(Hα) value. The median trends show that I3.3/I21 does not show the same decrease with EW(Hα) as the ratios of the other PAH bands.
Current usage metrics show cumulative count of Article Views (full-text article views including HTML views, PDF and ePub downloads, according to the available data) and Abstracts Views on Vision4Press platform.
Data correspond to usage on the plateform after 2015. The current usage metrics is available 48-96 hours after online publication and is updated daily on week days.
Initial download of the metrics may take a while.