Fig. 6.
Download original image
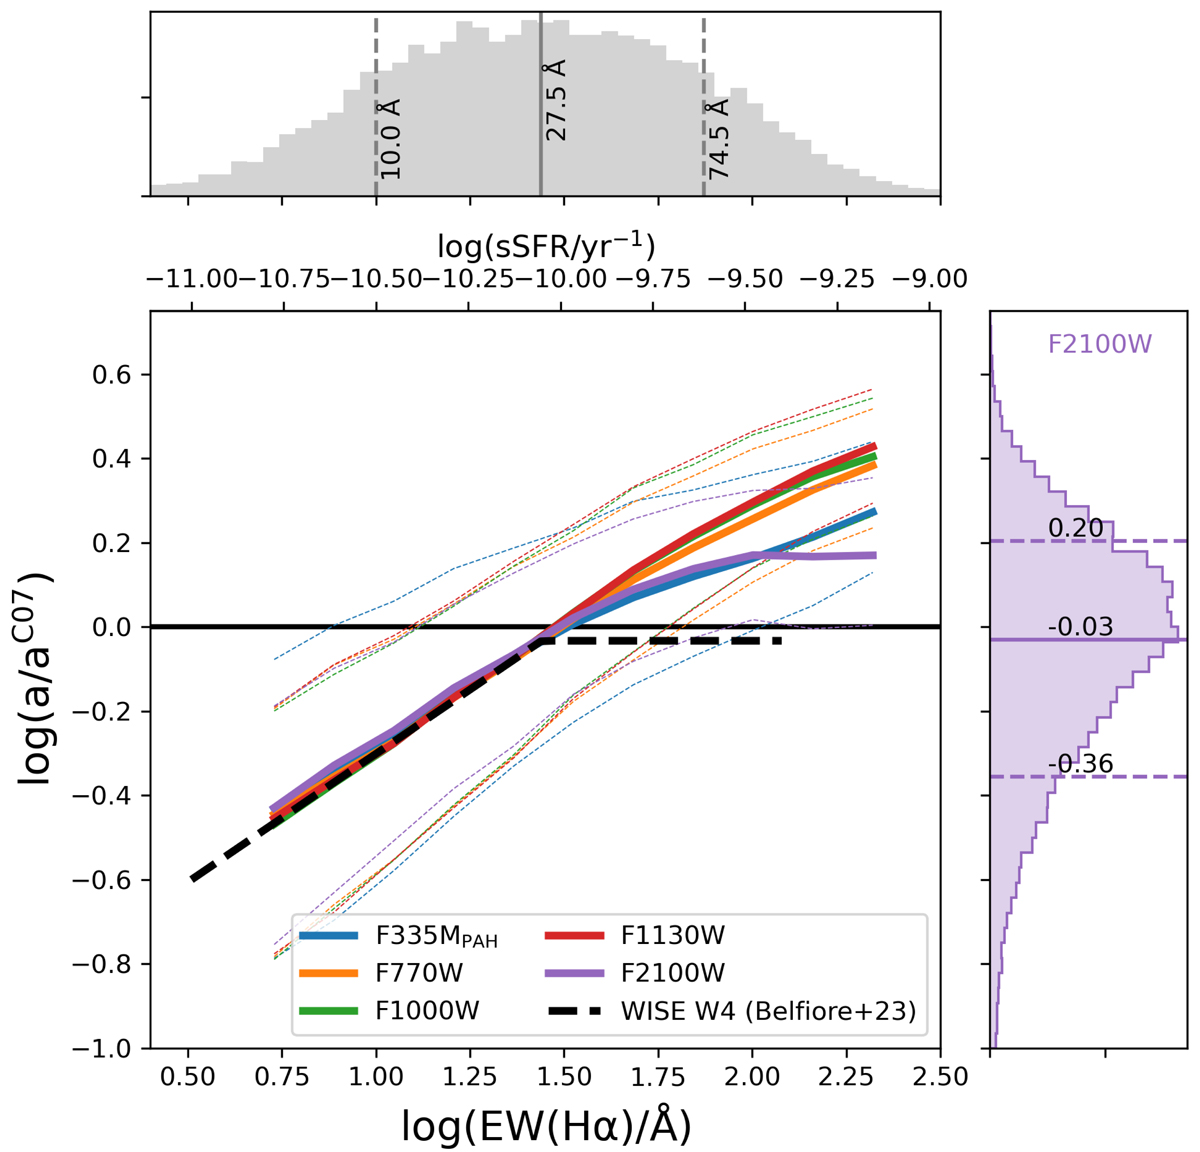
log aband normalised to the C07-equivalent values as a function of EW(Hα) and sSFR (alternative x-axis on top) for H II regions in our sample, where band = [F335MPAH (blue), F770W (orange), F1000W (green), F1130W (red), F2100W (purple)]. The coloured solid lines represent the median relations, while the coloured dashed lines show the 16th and 84th percentiles of the distribution. The black dashed line is the best-fit to the low-resolution (kpc-scale) Hα + WISE W4 data from Belfiore et al. (2023). The grey histogram (top) shows the distribution of EW(Hα) in the H II regions used in this work (with 16th, 50th, 84th percentiles marked and labelled). The purple histogram (right) shows the distribution of ![]() for the region in our sample, with the 16th, 50th, 84th percentiles marked and labelled.
for the region in our sample, with the 16th, 50th, 84th percentiles marked and labelled.
Current usage metrics show cumulative count of Article Views (full-text article views including HTML views, PDF and ePub downloads, according to the available data) and Abstracts Views on Vision4Press platform.
Data correspond to usage on the plateform after 2015. The current usage metrics is available 48-96 hours after online publication and is updated daily on week days.
Initial download of the metrics may take a while.