Fig. 5.
Download original image
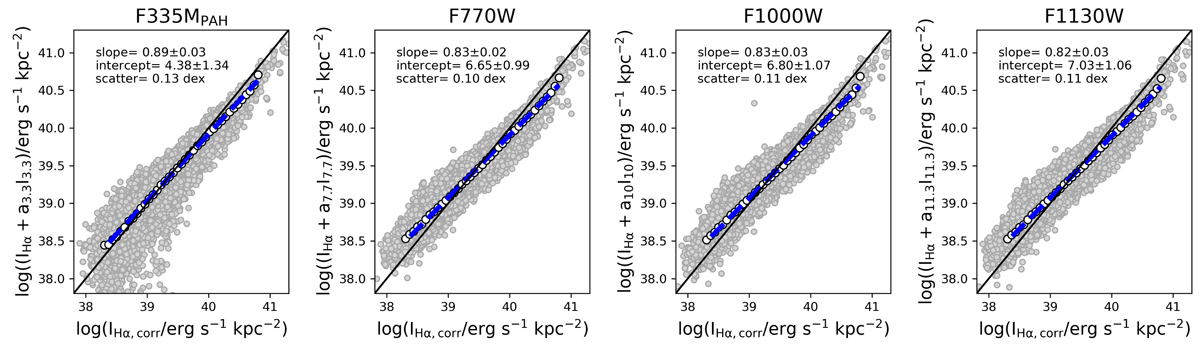
Comparison of Hα hybridised with F335MPAH, F770W, F1000W and F1130W and the attenuation-corrected Hα obtained using the Balmer decrement. The dashed blue line is the best linear fit while the white circles represent a binned average. The slope and intercept of the best-fit power law together with the scatter with respect to the best model are reported on the top left corner. The solid black line represents the one-to-one relation.
Current usage metrics show cumulative count of Article Views (full-text article views including HTML views, PDF and ePub downloads, according to the available data) and Abstracts Views on Vision4Press platform.
Data correspond to usage on the plateform after 2015. The current usage metrics is available 48-96 hours after online publication and is updated daily on week days.
Initial download of the metrics may take a while.