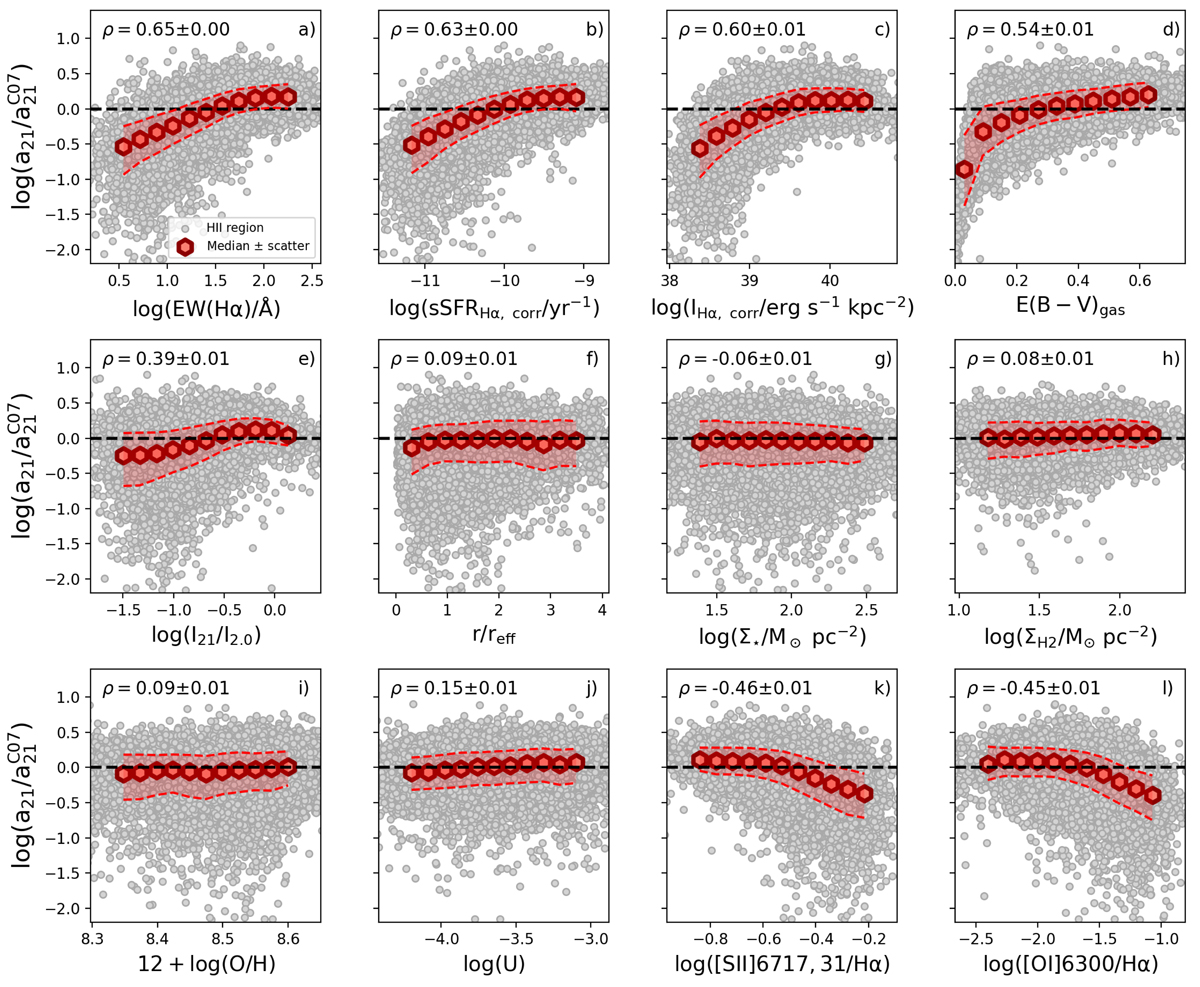
Fig. 4.
Download original image
Measured coefficient a21 normalised to the (rescaled) value from Calzetti et al. (2007) for H II regions as a function of several physical properties. Grey points are individual H II regions, while red hexagons represent the median values as a function of the quantity on the x-axis. In each panel we report the values of the Spearman rank correlation coefficient (and its error). The 16th–84th percentiles are shown as a red shaded area. The quantities considered on the x-axis are (a) equivalent width of Hα in emission, (b) sSFR surface density, defined as the ratio between the SFR surface density obtained from dust attenuation corrected Hα (assuming a fully sampled IMF) and the stellar mass surface density measured from MUSE data via spectral fitting (Σ⋆), (c) Hα luminosity per unit area corrected for dust attenuation with the Balmer decrement (IHα, corr), (d) E(B − V) of the gas obtained from the Balmer decrement, (e) ratio of the luminosity per unit area in F2100W to that in F200M (I21/I2.0), (f) luminosity per unit area in F2100W, (g) MUSE stellar mass surface density from fits to the stellar population to optical spectra, (h) molecular gas surface density, derived from ALMA CO(2−1), (i) gas-phase metallicity, (j) ionisation parameter, (k) [S II]λλ6717,31/Hα ratio, and (l) [O I] λ6300/Hα ratio.
Current usage metrics show cumulative count of Article Views (full-text article views including HTML views, PDF and ePub downloads, according to the available data) and Abstracts Views on Vision4Press platform.
Data correspond to usage on the plateform after 2015. The current usage metrics is available 48-96 hours after online publication and is updated daily on week days.
Initial download of the metrics may take a while.