Fig. 3.
Download original image
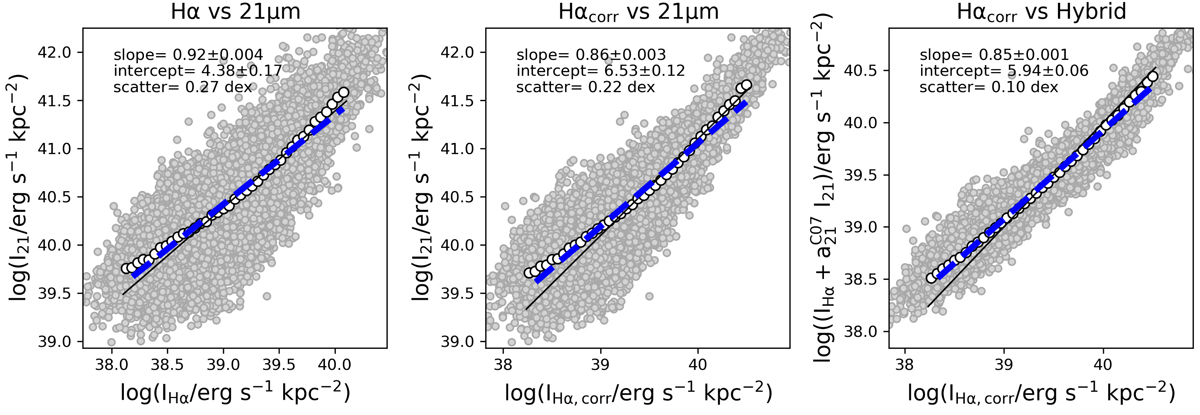
Scaling relations between I21 and IHα for H II regions. Left: I21 as a function of IHα for the H II regions (grey points) in our sample. The white dots represent the median relation, while the blue dashed line is the best-fit power law obtained by fitting the data considering the errors associated with the quantities on both axes. The solid black line shows a linear relation normalised to match the data at high surface brightness. The slope and intercept of the best-fit power law together with the scatter with respect to the best model are reported in the top left corner. The meaning of the symbols and lines is the same across the three panels, except that the solid black line the right panel represents a one-to-one relation. Middle: I21 as a function of IHα, corr. Right: ![]() as a function of IHα, corr.
as a function of IHα, corr.
Current usage metrics show cumulative count of Article Views (full-text article views including HTML views, PDF and ePub downloads, according to the available data) and Abstracts Views on Vision4Press platform.
Data correspond to usage on the plateform after 2015. The current usage metrics is available 48-96 hours after online publication and is updated daily on week days.
Initial download of the metrics may take a while.