Fig. 2.
Download original image
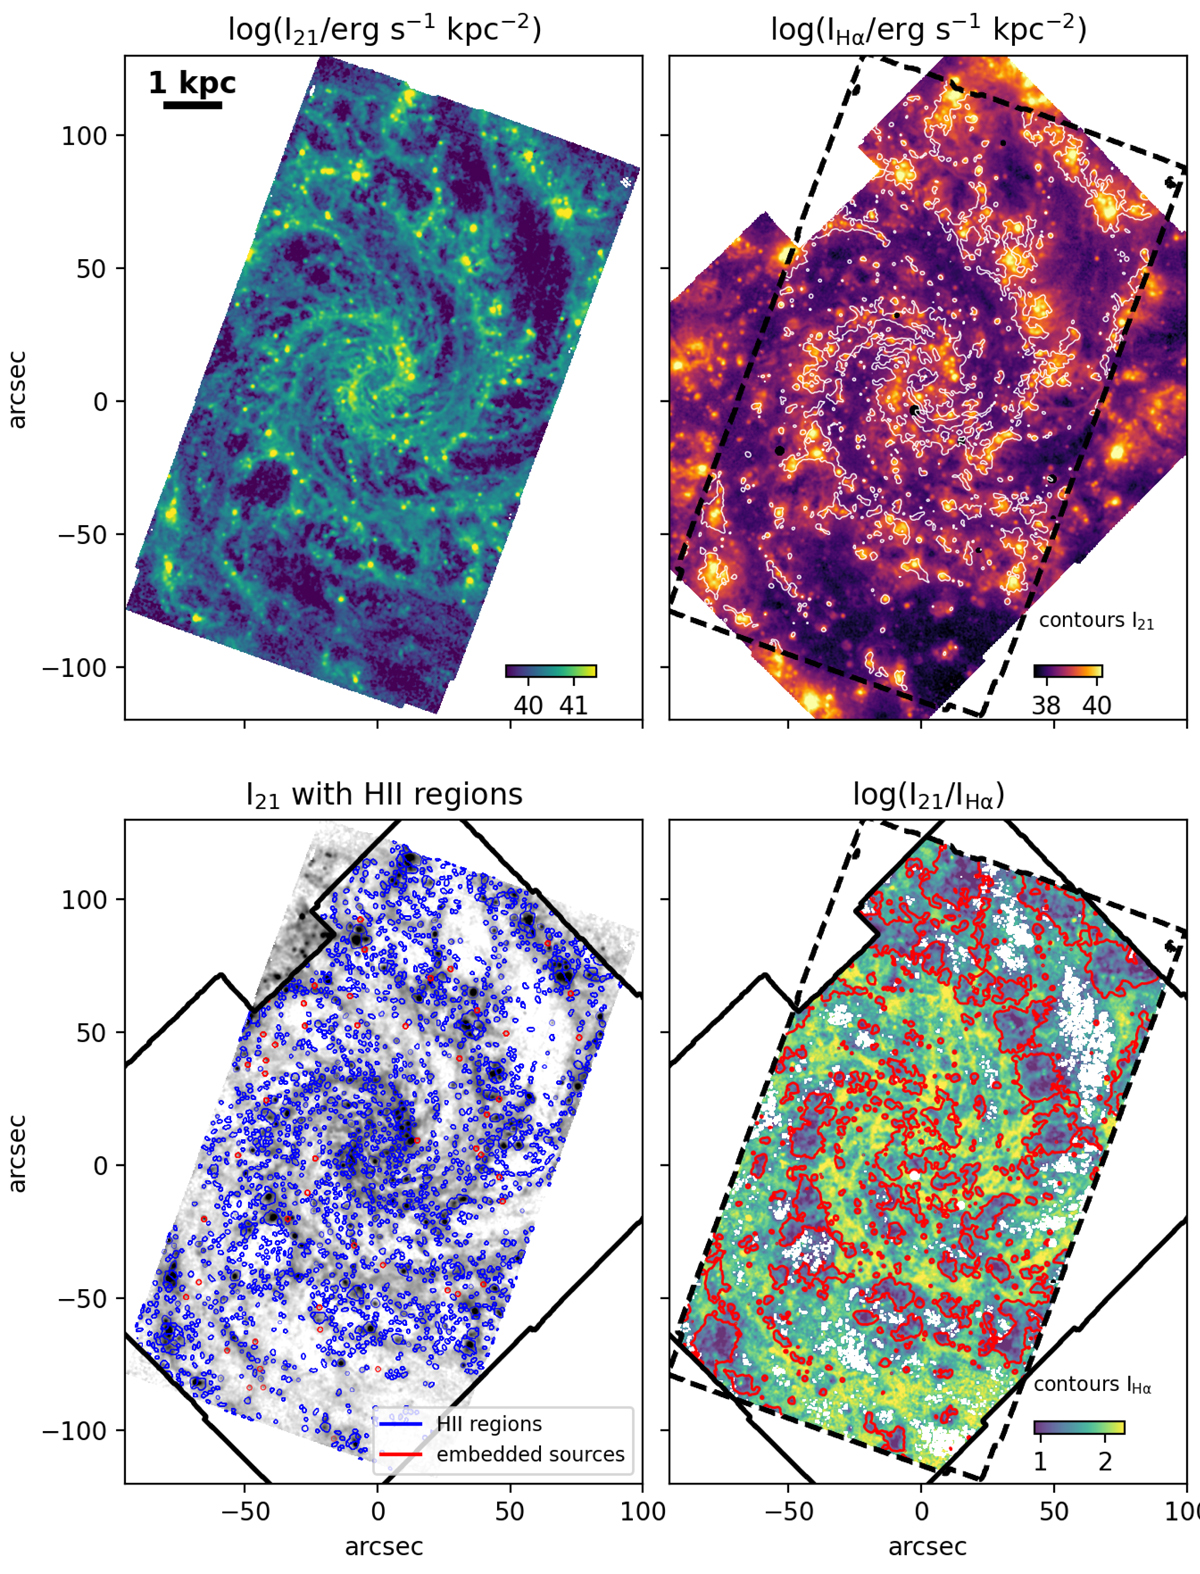
Comparison of the Hα and 21 μm emission for NGC 0628. Top-left: 21 μm surface brightness image obtained using the F2100W filter on MIRI, convolved to the MUSE copt resolution (0.92″). Top-right: map of the Hα surface brightness from MUSE (Emsellem et al. 2022). White contours enclose regions of bright 21 μm emission (I21 > 1040.5 erg s−1 kpc−2). Bottom-left: same as top-left, but with the boundaries of the optically selected H II regions from Groves et al. (2023) in blue and the 21 μm sources which do not overlap with optical H II regions from Hassani et al. (2023) in red. Bottom-right: ratio map of the Hα to F2100W surface brightness. Red contours are bright Hα regions, IHα > 1038.8 erg s−1 kpc−2. White regions within the mapped area represent areas with S/N < 3 in F2100W. The boundaries of the MUSE (solid black) and MIRI (dashed black) mosaics are shown to aid in visualising the data overlap.
Current usage metrics show cumulative count of Article Views (full-text article views including HTML views, PDF and ePub downloads, according to the available data) and Abstracts Views on Vision4Press platform.
Data correspond to usage on the plateform after 2015. The current usage metrics is available 48-96 hours after online publication and is updated daily on week days.
Initial download of the metrics may take a while.