Fig. 1.
Download original image
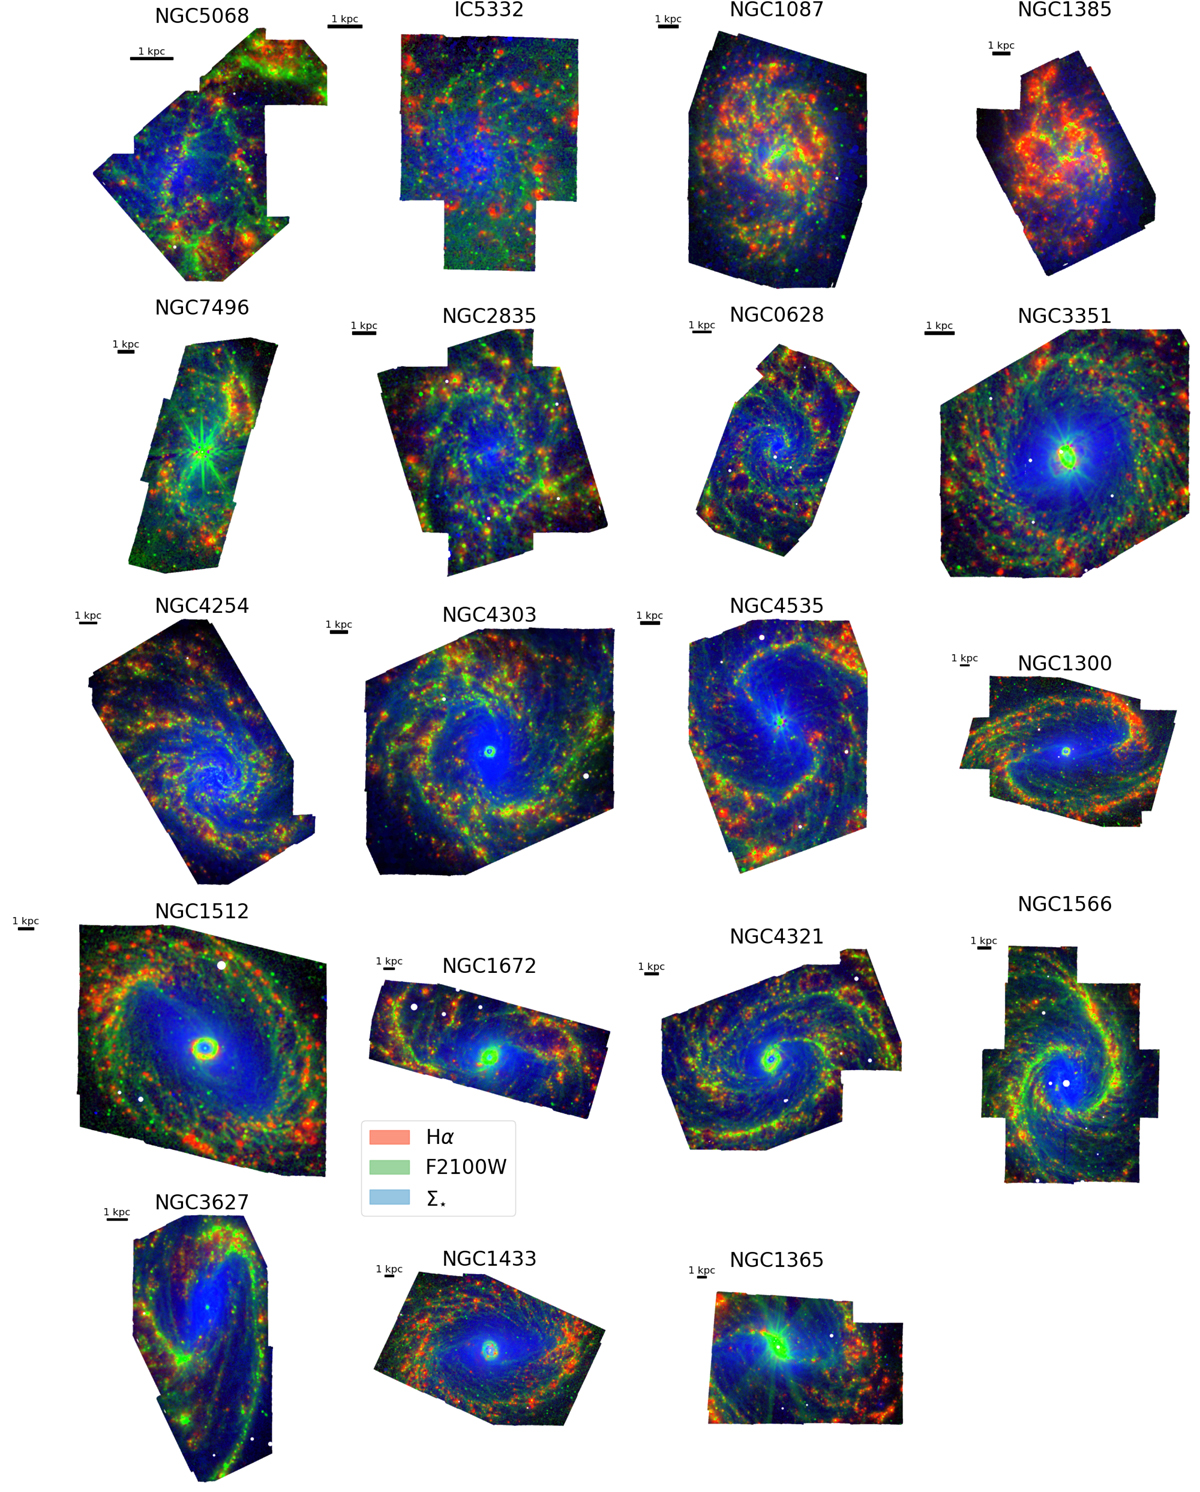
Three-colour images for the galaxies in our sample showing a combination of Hα emission from MUSE IFS (red), 21 μm emission from JWST MIRI F2100W images (green), and stellar mass surface density from MUSE full spectral fitting (blue). The JWST data and MUSE data are shown at matched resolution. Galaxies are shown in order of increasing stellar mass. Foreground stars and the AGN in NGC 1566 and NGC 1365 are masked. The diffraction spikes due to bright AGN in NGC 4535, NGC 7496 and NGC 1365 are shown here but masked in subsequent analysis. The jagged edges of the images are caused by the intersection between the MUSE and MIRI image coverage.
Current usage metrics show cumulative count of Article Views (full-text article views including HTML views, PDF and ePub downloads, according to the available data) and Abstracts Views on Vision4Press platform.
Data correspond to usage on the plateform after 2015. The current usage metrics is available 48-96 hours after online publication and is updated daily on week days.
Initial download of the metrics may take a while.