Fig. 5
Download original image
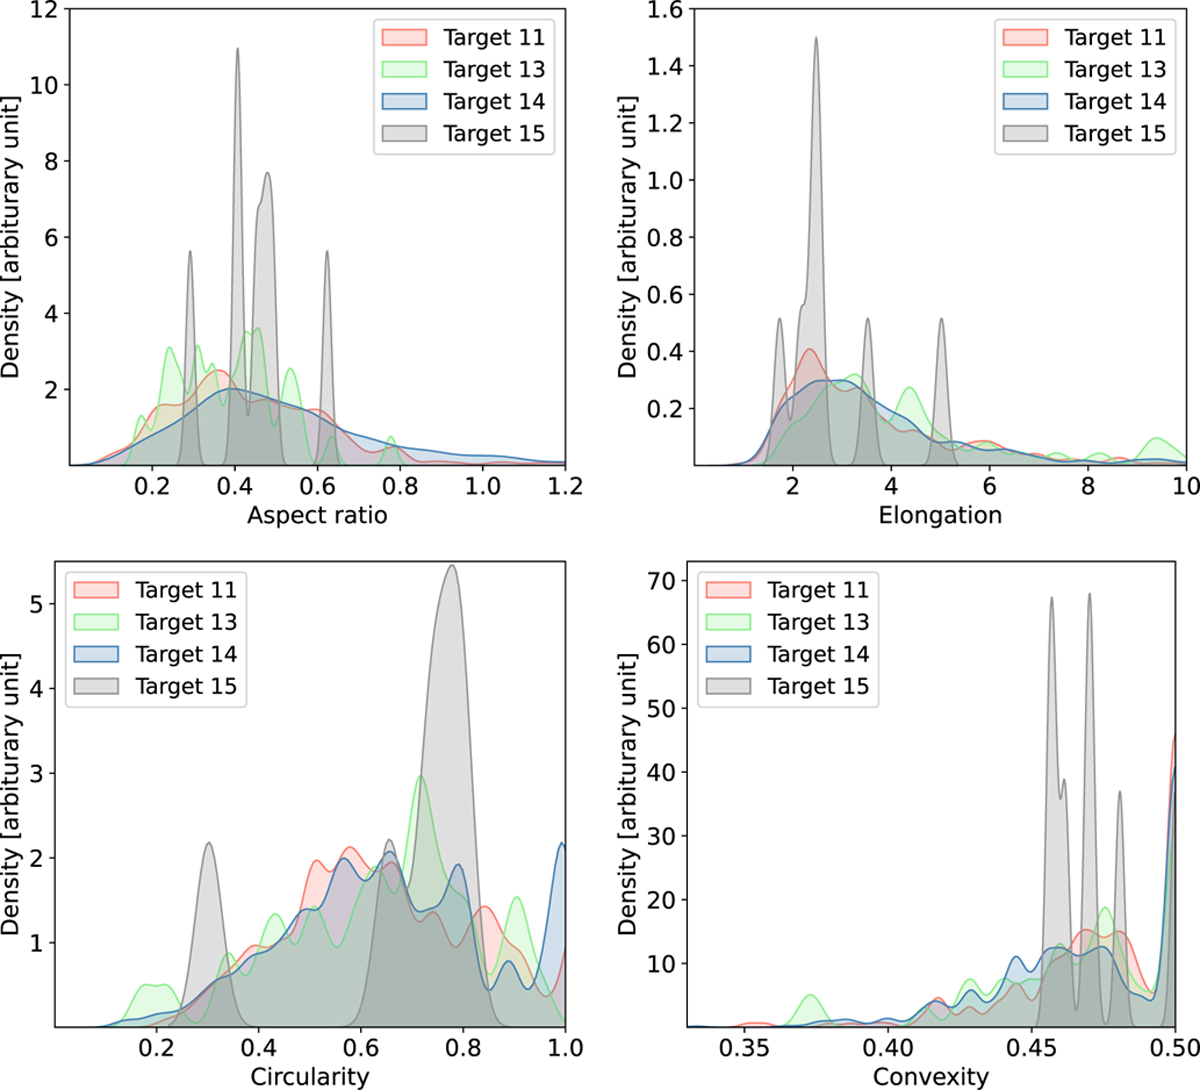
Density plots of MIDAS particle shape descriptors for each dust collection target. The graph of target 15 shows narrow high spikes due to low statistics, contrary to the smooth graph of target 14 resulting from a high number of data points. Overall, the particle shapes seem to be similarly distributed independently from the collection target, i.e., the collection velocity, the cometary source region, or the period of dust emission from the comet.
Current usage metrics show cumulative count of Article Views (full-text article views including HTML views, PDF and ePub downloads, according to the available data) and Abstracts Views on Vision4Press platform.
Data correspond to usage on the plateform after 2015. The current usage metrics is available 48-96 hours after online publication and is updated daily on week days.
Initial download of the metrics may take a while.