Fig. 5
Download original image
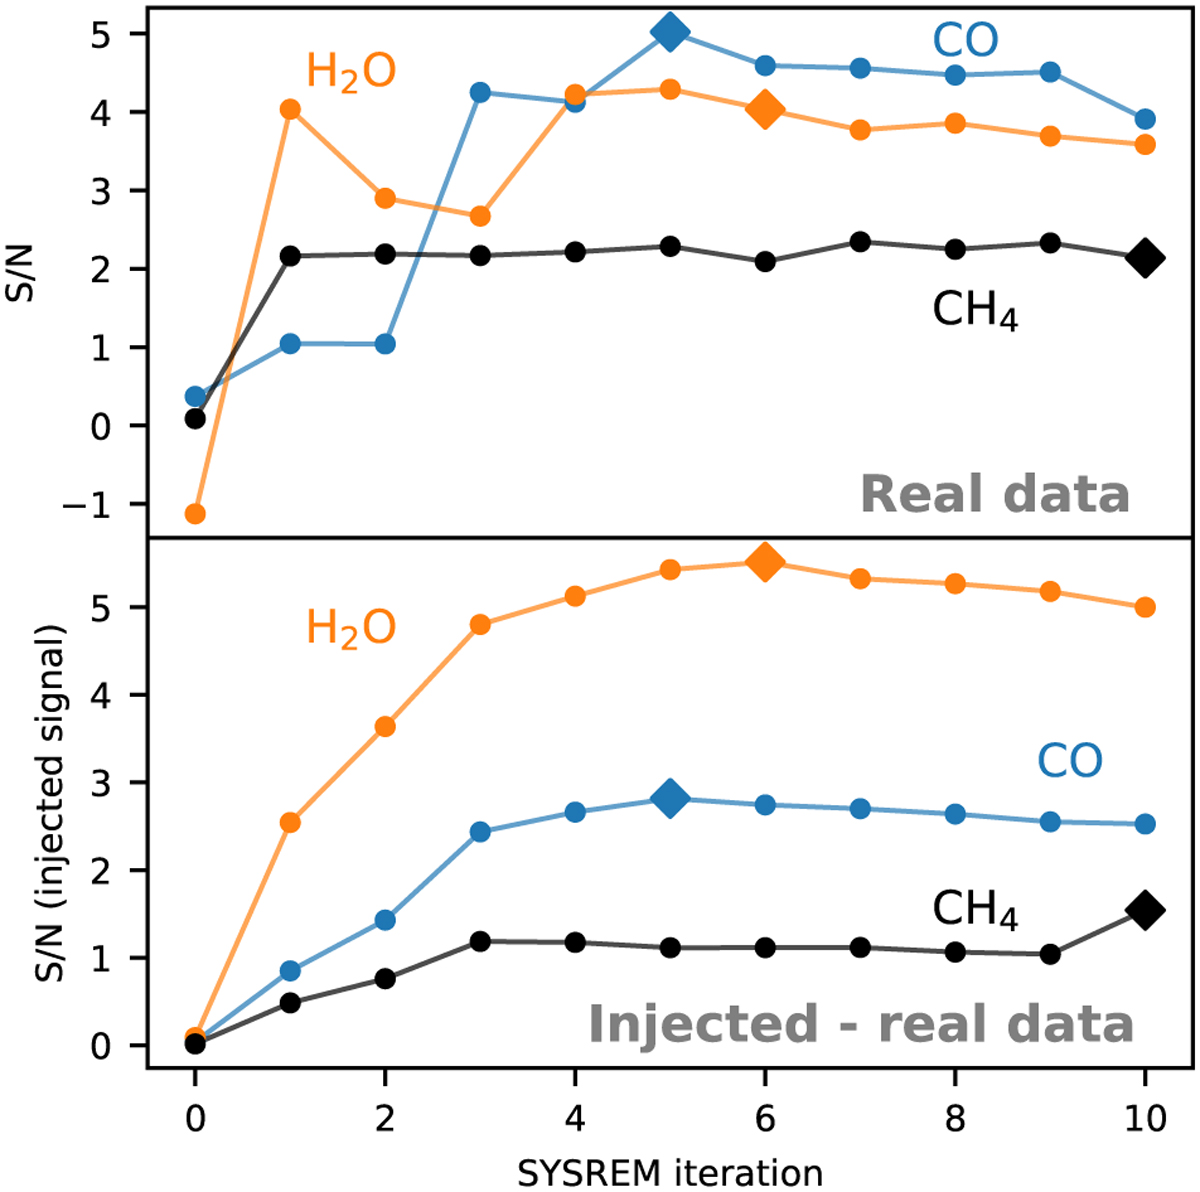
S/N detection strength as a function of SYSREM iterations for the data of night 1. The measured signal strengths are a result of using a pure CO model (blue colour), a pure H2O model (orange colour), and a pure CH4 model (black colour). The top panel shows the signal strength for the real data, while the bottom panel shows the strength of an injected signal using the differential ΔCCF according to the method described in Sect. 3.3. The diamond shape indicates the SYSREM iteration with the strongest detection of the injected signal.
Current usage metrics show cumulative count of Article Views (full-text article views including HTML views, PDF and ePub downloads, according to the available data) and Abstracts Views on Vision4Press platform.
Data correspond to usage on the plateform after 2015. The current usage metrics is available 48-96 hours after online publication and is updated daily on week days.
Initial download of the metrics may take a while.