Open Access
Fig. 4
Download original image
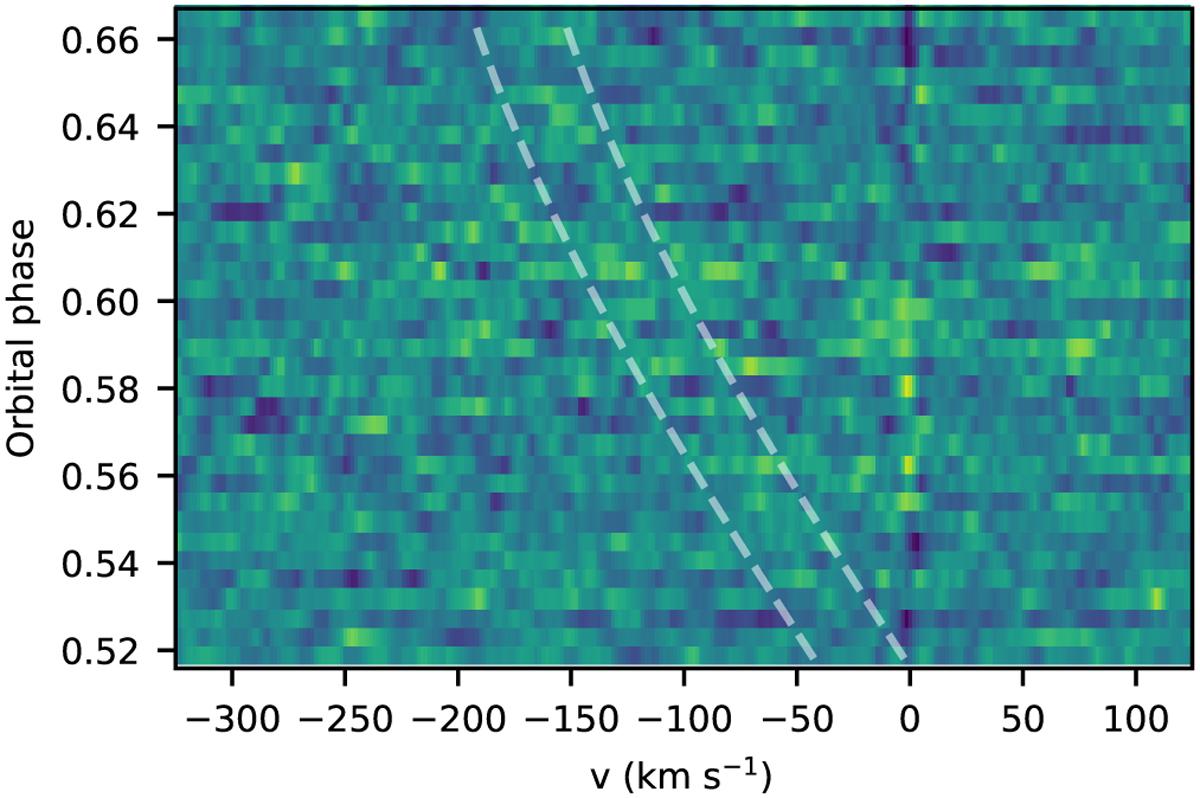
Cross-correlation function of CO for night 1 after five sysrem iterations. The dashed lines indicate the expected planetary trail after the eclipse (which is located between the two lines). The noise structure at υ = 0 kms−1 is caused by tellurics that could not be completely removed.
Current usage metrics show cumulative count of Article Views (full-text article views including HTML views, PDF and ePub downloads, according to the available data) and Abstracts Views on Vision4Press platform.
Data correspond to usage on the plateform after 2015. The current usage metrics is available 48-96 hours after online publication and is updated daily on week days.
Initial download of the metrics may take a while.