Fig. A.1
Download original image
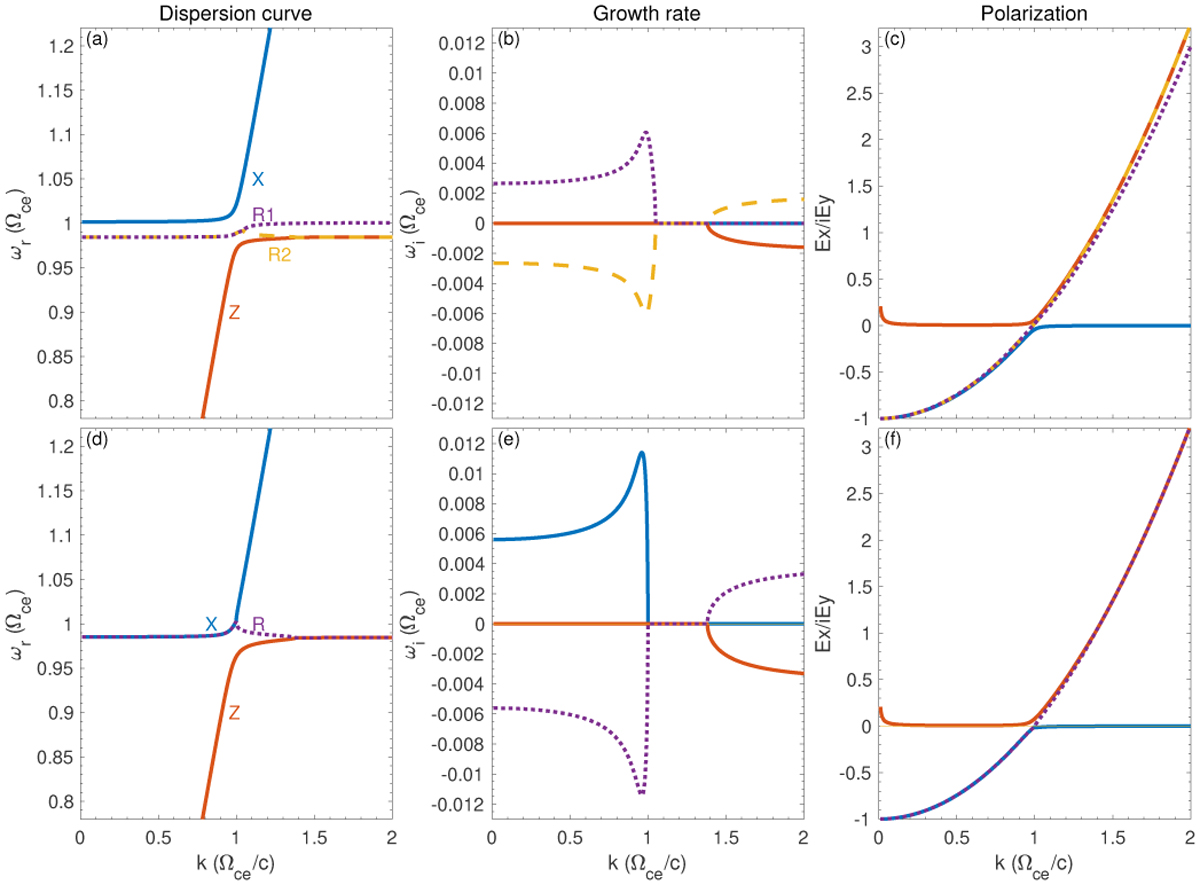
Dispersion relation (a, d) and growth rates (b, e) of the extraordinary wave modes according to the kinetic linear theory, with ne/n0 = 24% (upper panels) and 100% (lower panels). The blue and red lines refer to the X and Z modes; the purple and yellow lines refer to the two branches of the relativistic modes (R1 and R2). Panels (c) and (f) present the corresponding intensity ratio of Ex/iEy for each mode.
Current usage metrics show cumulative count of Article Views (full-text article views including HTML views, PDF and ePub downloads, according to the available data) and Abstracts Views on Vision4Press platform.
Data correspond to usage on the plateform after 2015. The current usage metrics is available 48-96 hours after online publication and is updated daily on week days.
Initial download of the metrics may take a while.