Fig. 1
Download original image
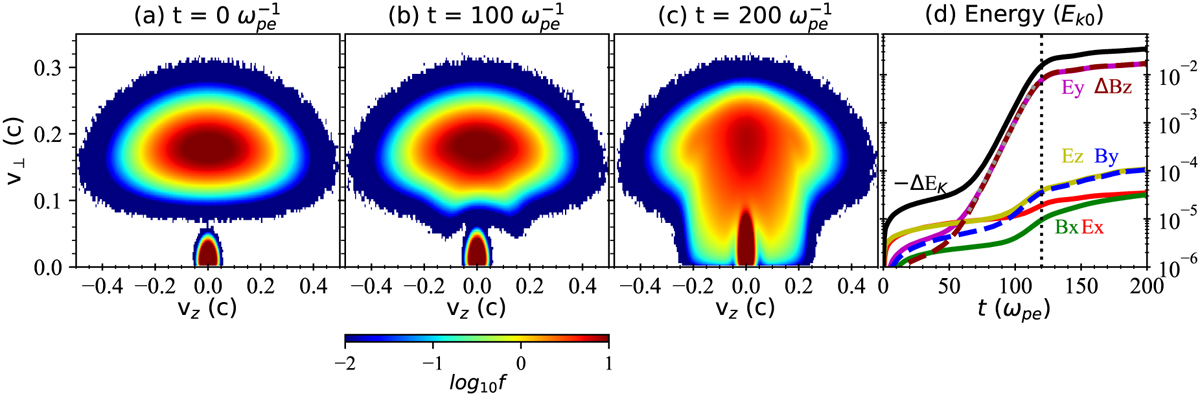
Evolution of electron VDFs and energy profiles of the simulation with ne/n0 = 24%. Panels a–c: snapshots of the VDFs at the start (a, t = 0 ![]() ), middle (b, 100
), middle (b, 100 ![]() ), and end (c, 200
), and end (c, 200 ![]() ) of the simulation. Panel d: Temporal variations of energies of the six fluctuated field components. The black line represents the decline of the electron kinetic energy (−ΔEk). The energies are normalized to the initial kinetic energy of the total electrons. The gray dashed line represents the exponential fitting of the energy profiles. The vertical dotted line in (d) indicates the separate time (120
) of the simulation. Panel d: Temporal variations of energies of the six fluctuated field components. The black line represents the decline of the electron kinetic energy (−ΔEk). The energies are normalized to the initial kinetic energy of the total electrons. The gray dashed line represents the exponential fitting of the energy profiles. The vertical dotted line in (d) indicates the separate time (120 ![]() ) of the linear stage and the saturation stage.
) of the linear stage and the saturation stage.
Current usage metrics show cumulative count of Article Views (full-text article views including HTML views, PDF and ePub downloads, according to the available data) and Abstracts Views on Vision4Press platform.
Data correspond to usage on the plateform after 2015. The current usage metrics is available 48-96 hours after online publication and is updated daily on week days.
Initial download of the metrics may take a while.