Fig. 1
Download original image
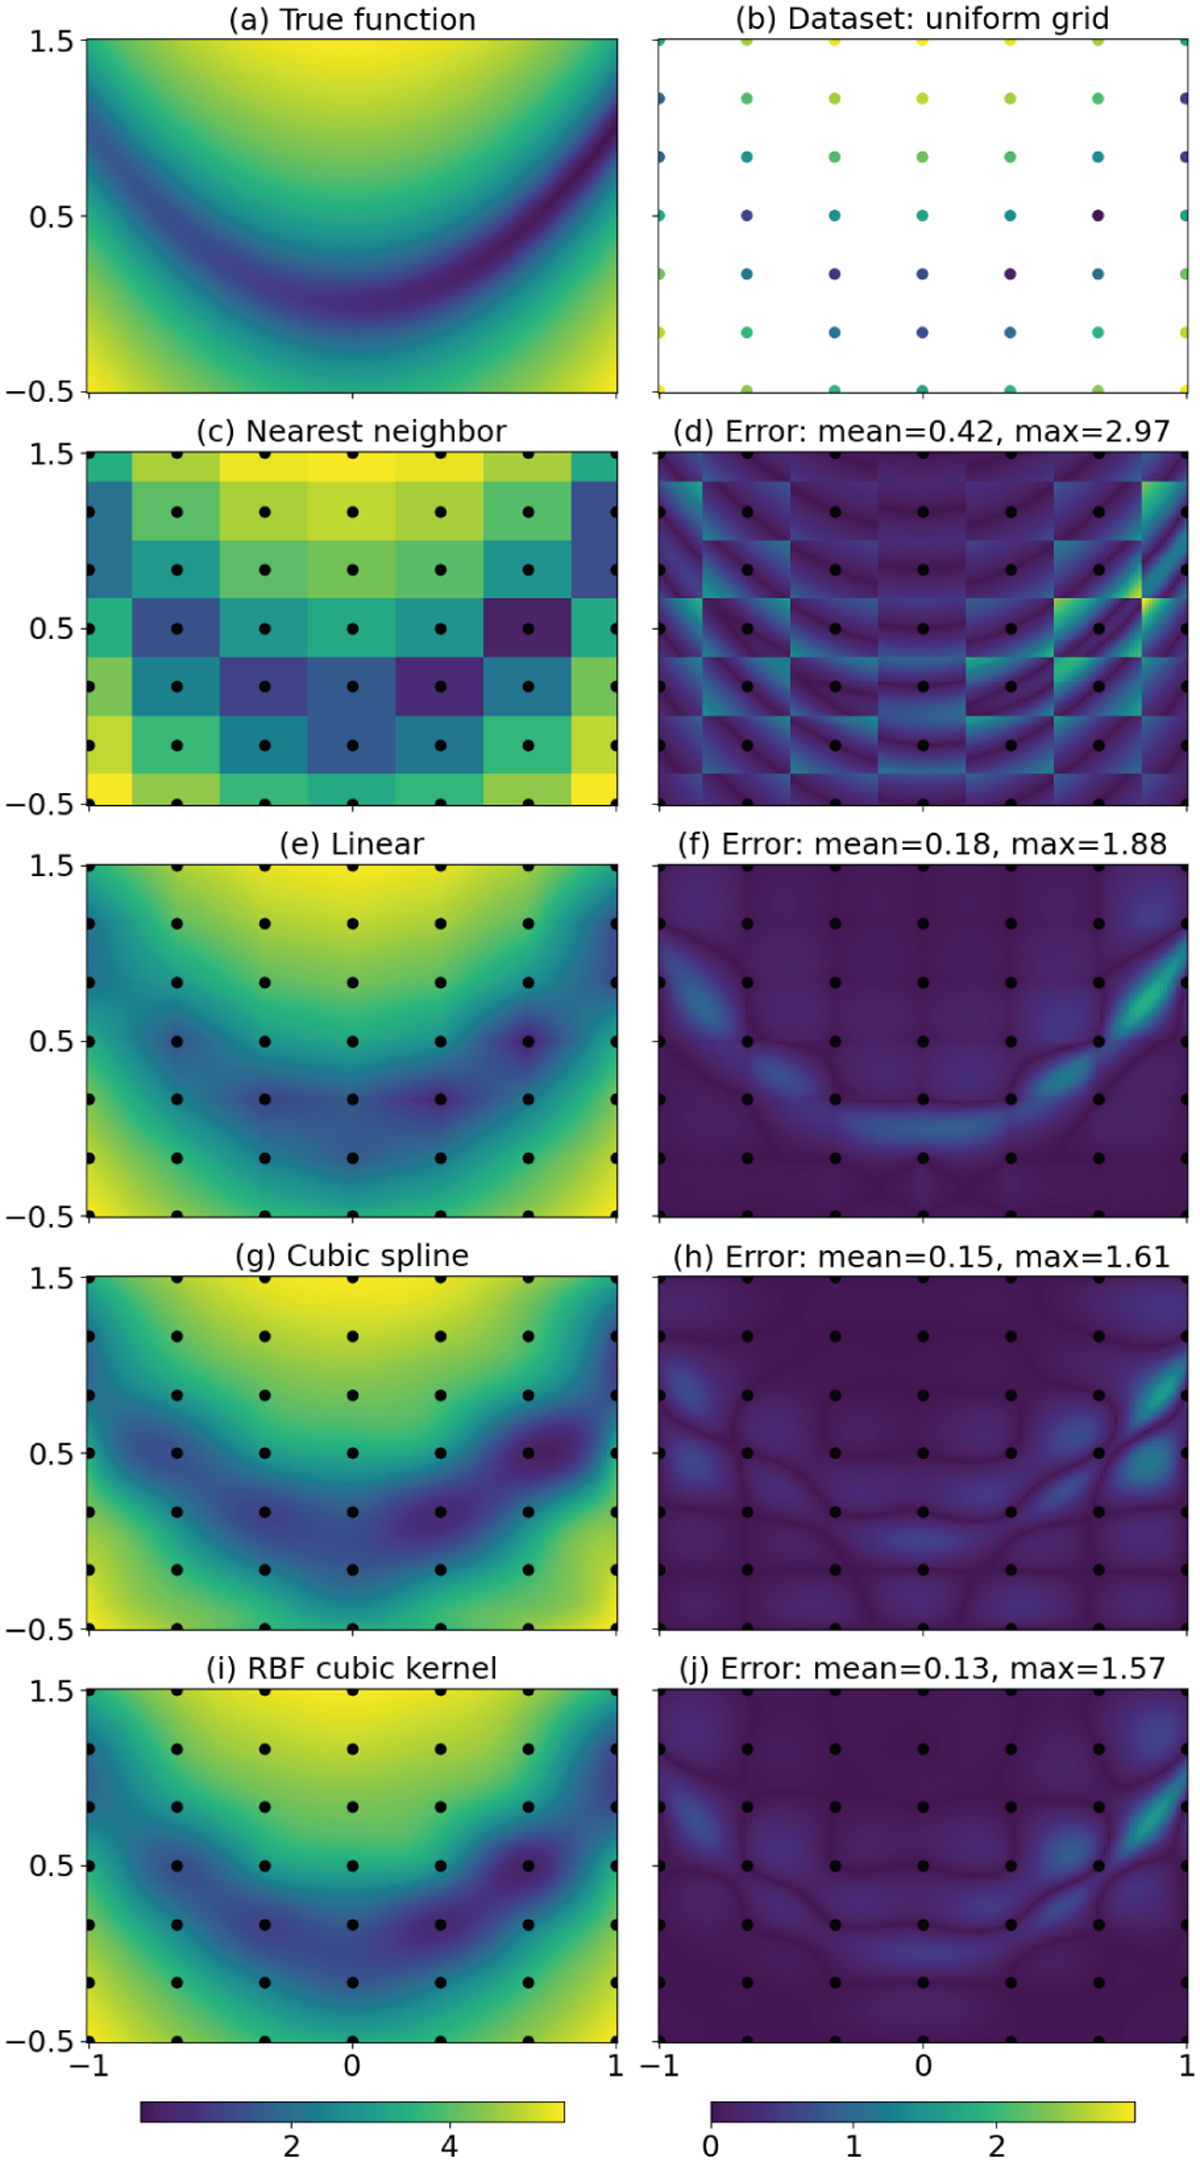
Comparison of the most popular interpolation methods on the log Rosenbrock function with a dataset structured as a coarse regular grid. (a) Log Rosenbrock function log R (Eq. (1)), i.e., the true function that interpolation methods are to emulate. (b) Coarse uniform grid and corresponding values of the true function. All four interpolation methods are fitted using these values only. The grid is also shown on the remaining figures. (c), (e), (g), and (i) Surrogate model obtained with each interpolation algorithm. (d), (f), (h), and (j) Absolute error (Eq. (2)) between the corresponding surrogate model and the true function.
Current usage metrics show cumulative count of Article Views (full-text article views including HTML views, PDF and ePub downloads, according to the available data) and Abstracts Views on Vision4Press platform.
Data correspond to usage on the plateform after 2015. The current usage metrics is available 48-96 hours after online publication and is updated daily on week days.
Initial download of the metrics may take a while.