Open Access
Fig. 4
Download original image
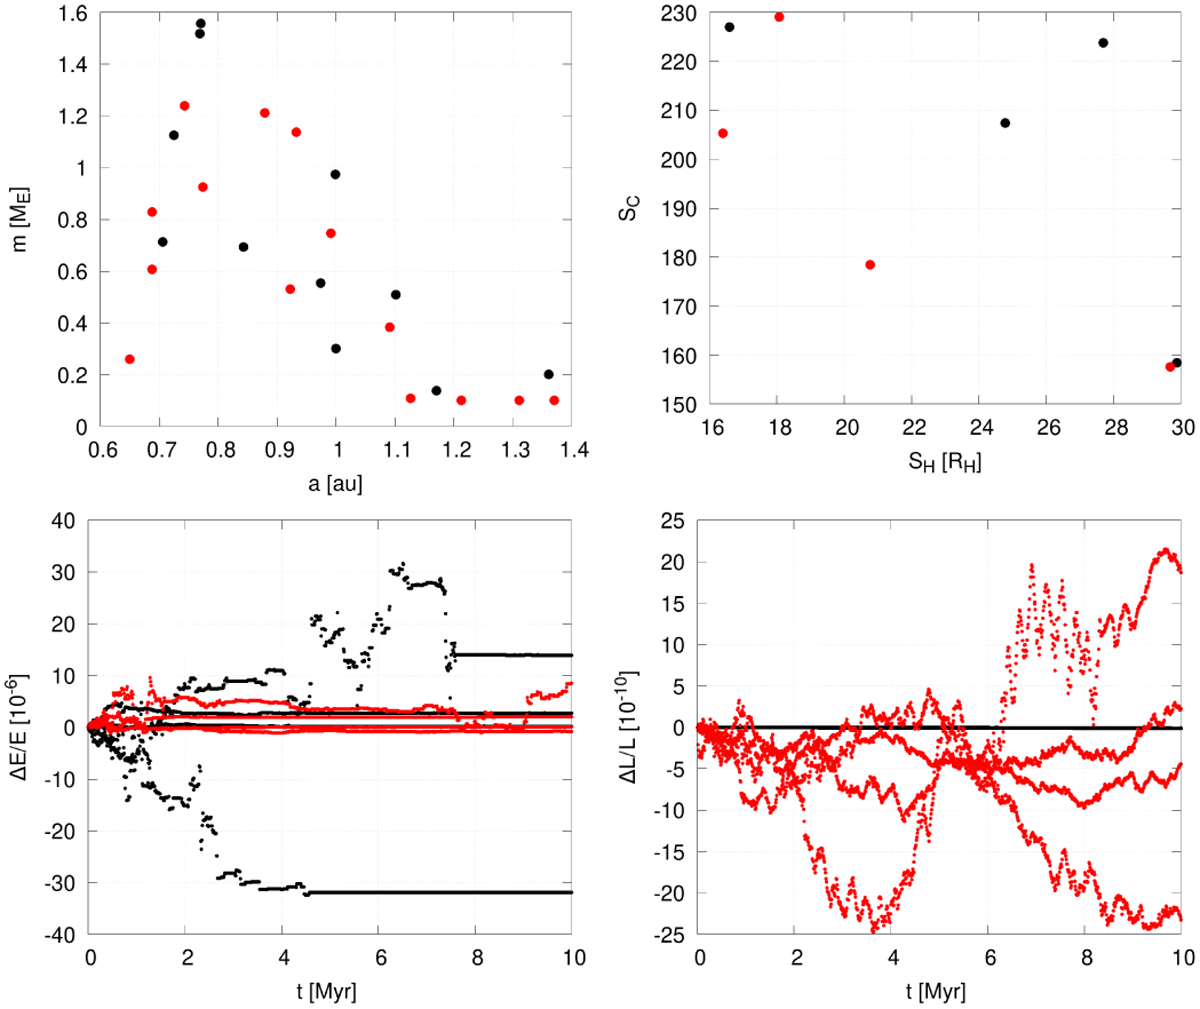
Output of the embryo experiment. The top-left panel depicts final mass versus semi-major axis, the top-right panel shows the concentration versus spacing parameters, the bottom-left panel is ∆E/E, and the bottom-right panel is ∆L/L. Black dots are for simulations run with FP64 forces, red for FP32.
Current usage metrics show cumulative count of Article Views (full-text article views including HTML views, PDF and ePub downloads, according to the available data) and Abstracts Views on Vision4Press platform.
Data correspond to usage on the plateform after 2015. The current usage metrics is available 48-96 hours after online publication and is updated daily on week days.
Initial download of the metrics may take a while.