Open Access
Fig. 9
Download original image
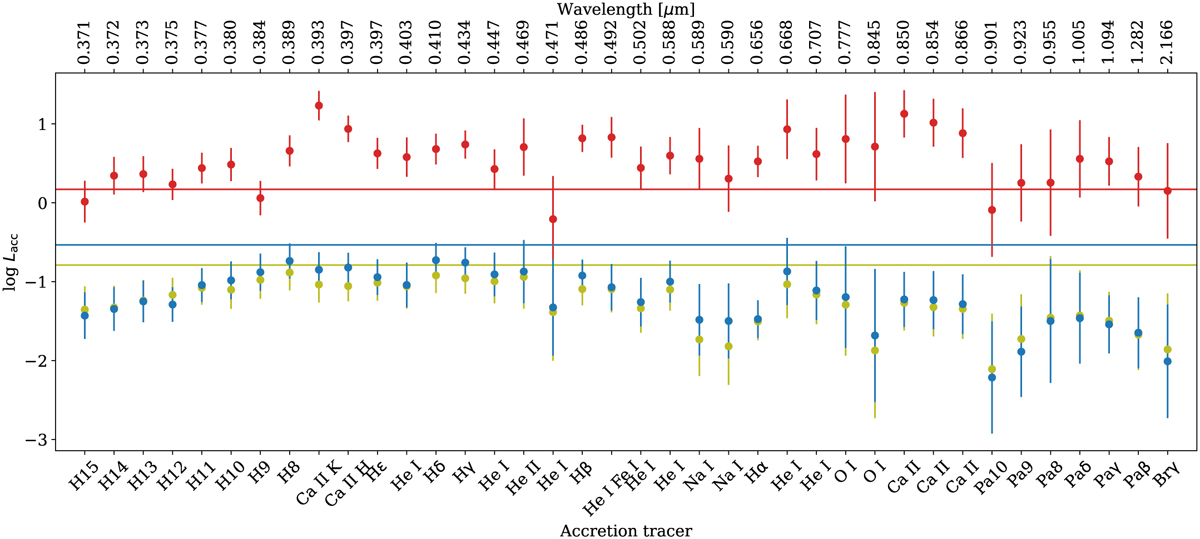
Accretion luminosity (Lacc) calculated for each line per epoch. Each epoch is represented by a different color as shown earlier: yellow for the 2010 May 4 epoch, red for 2022 March 27, and blue for 2022 July 29. The horizontal lines are the values obtained from the slab model fitting per epoch.
Current usage metrics show cumulative count of Article Views (full-text article views including HTML views, PDF and ePub downloads, according to the available data) and Abstracts Views on Vision4Press platform.
Data correspond to usage on the plateform after 2015. The current usage metrics is available 48-96 hours after online publication and is updated daily on week days.
Initial download of the metrics may take a while.