Fig. 7
Download original image
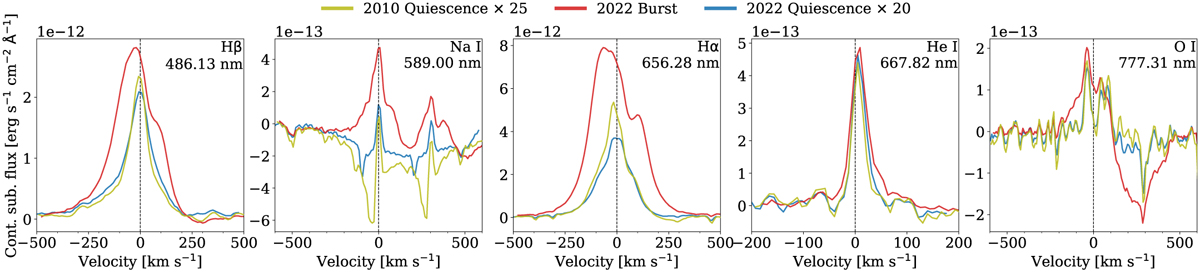
Continuum-subtracted spectra of five emission lines found in the three epochs of EX Lupi observations that we used to calculate the Lacc. For better visual comparison between epochs, the 2010 and 2022 spectra have been scaled up by factors of 25 and 20, respectively. Below the name of each line is the rest wavelength for each transition, with the exception of the О I triplet where the wavelength is in between the three transitions. The yellow, red, and blue lines represent the 2010 quiescent, 2022 bursting, and 2022 post-burst quiescent spectra taken with X-shooter. The x-axes are the heliocentric-corrected velocities calculated with respect to the rest wavelength, and the vertical dashed line indicates the zero velocity. A visual inspection of these spectral lines shows how the burst strengthened and broadened the lines and, in the case of the О I triplet, how the blending worsened as a result of this.
Current usage metrics show cumulative count of Article Views (full-text article views including HTML views, PDF and ePub downloads, according to the available data) and Abstracts Views on Vision4Press platform.
Data correspond to usage on the plateform after 2015. The current usage metrics is available 48-96 hours after online publication and is updated daily on week days.
Initial download of the metrics may take a while.