Fig. 5
Download original image
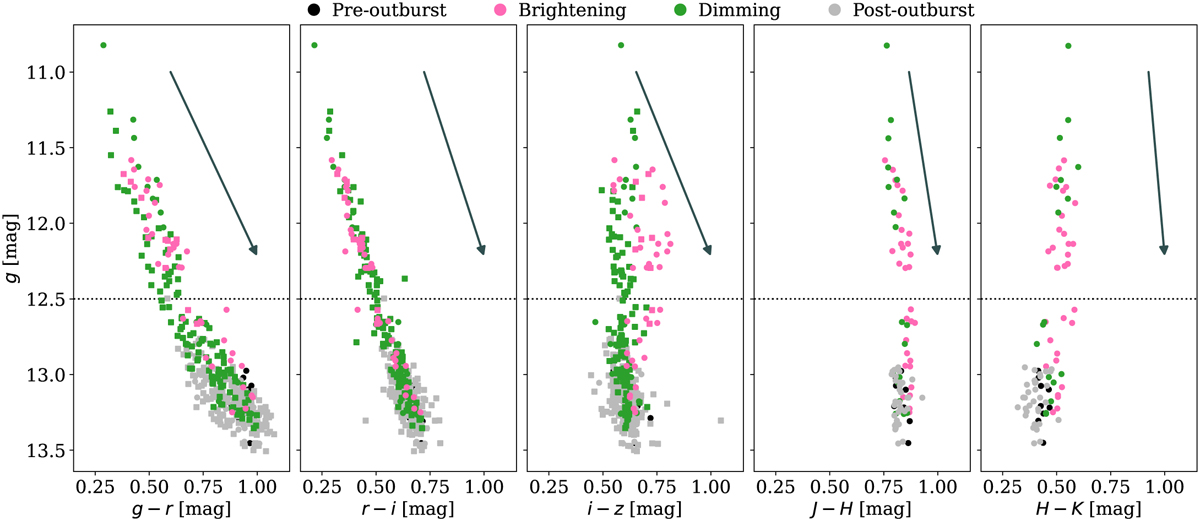
Color-magnitude diagrams for the optical and NIR photometry. The circle and square symbols are the REM and LCOGT observations, respectively. The colors indicate the different stages of the light curve, where black is the pre-burst quiescence, pink is the brightening phase, green is the dimming phase, and gray is the post-burst quiescence (cf. Sect. 4.1). The arrow is the AV = 1.1 mag extinction vector following the extinction curve of Cardelli et al. (1989). The dotted horizontal lines indicate the ɡ = 12.5 mag threshold indicative of when EX Lupi is in burst.
Current usage metrics show cumulative count of Article Views (full-text article views including HTML views, PDF and ePub downloads, according to the available data) and Abstracts Views on Vision4Press platform.
Data correspond to usage on the plateform after 2015. The current usage metrics is available 48-96 hours after online publication and is updated daily on week days.
Initial download of the metrics may take a while.