Fig. 2
Download original image
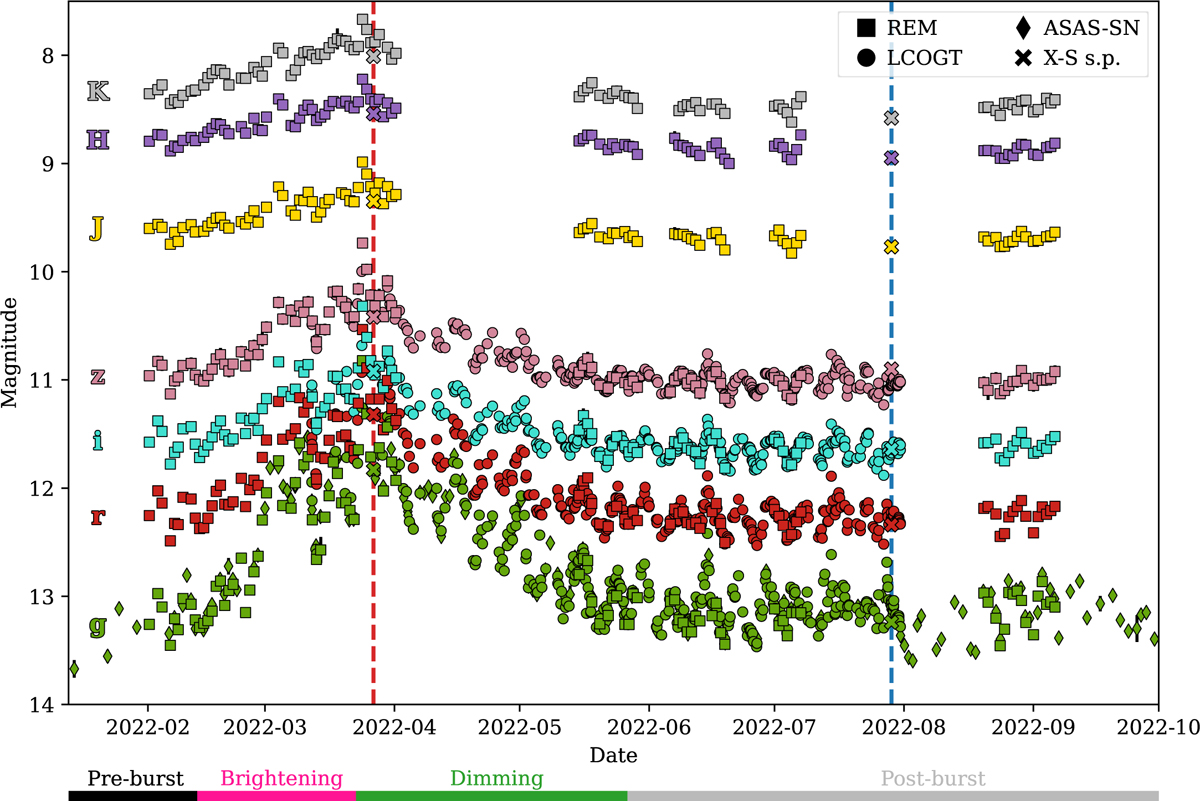
Light curve of EX Lupi using optical and NIR photometry. Each color represents a different filter. Colors are indicated on the left side of the plot. The square, circle, and diamond symbols represent the different telescopes used to construct the light curve, and the “X” symbol indicates the synthetic photometry of the X-shooter spectra. The dates when these spectroscopic observations were taken are indicated with vertical dashed lines. The LCOGT and ASAS-SN magnitudes include the shifts mentioned in Sect. 3.1. The colored line beneath the light curve indicates the start and end dates of the different stages of the light curve.
Current usage metrics show cumulative count of Article Views (full-text article views including HTML views, PDF and ePub downloads, according to the available data) and Abstracts Views on Vision4Press platform.
Data correspond to usage on the plateform after 2015. The current usage metrics is available 48-96 hours after online publication and is updated daily on week days.
Initial download of the metrics may take a while.