Fig. 11
Download original image
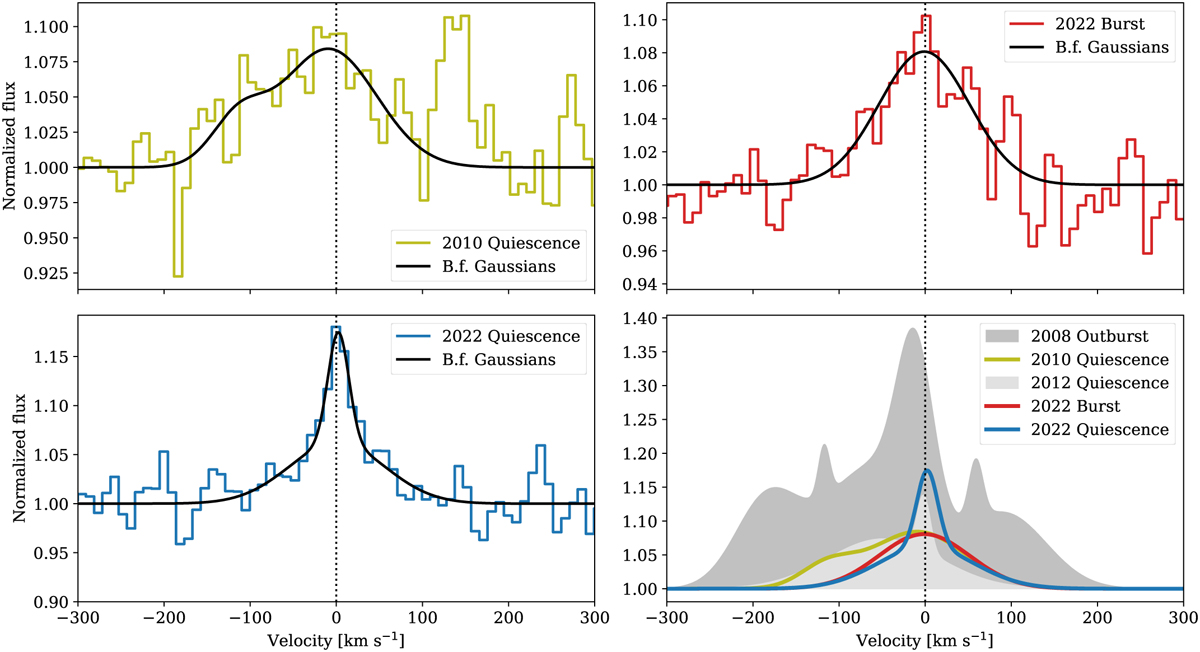
Evolution of the [O I] line due to the 2022 burst and a comparison with the line profiles seen during and after the 2008 outburst. The top panels and the bottom-left panel show the [O I] line profile from the three X-shooter spectra analyzed in this work as a colored line and the best-fit Gaussians with a black line. In the bottom-right panel, we use colored lines to show the best-fit Gaussians and shaded-gray areas to show the best-fit Gaussians by Banzatti et al. (2019) calculated on their high-resolution spectra taken during the 2008 outburst and in quiescence in 2012.
Current usage metrics show cumulative count of Article Views (full-text article views including HTML views, PDF and ePub downloads, according to the available data) and Abstracts Views on Vision4Press platform.
Data correspond to usage on the plateform after 2015. The current usage metrics is available 48-96 hours after online publication and is updated daily on week days.
Initial download of the metrics may take a while.