Fig. 1
Download original image
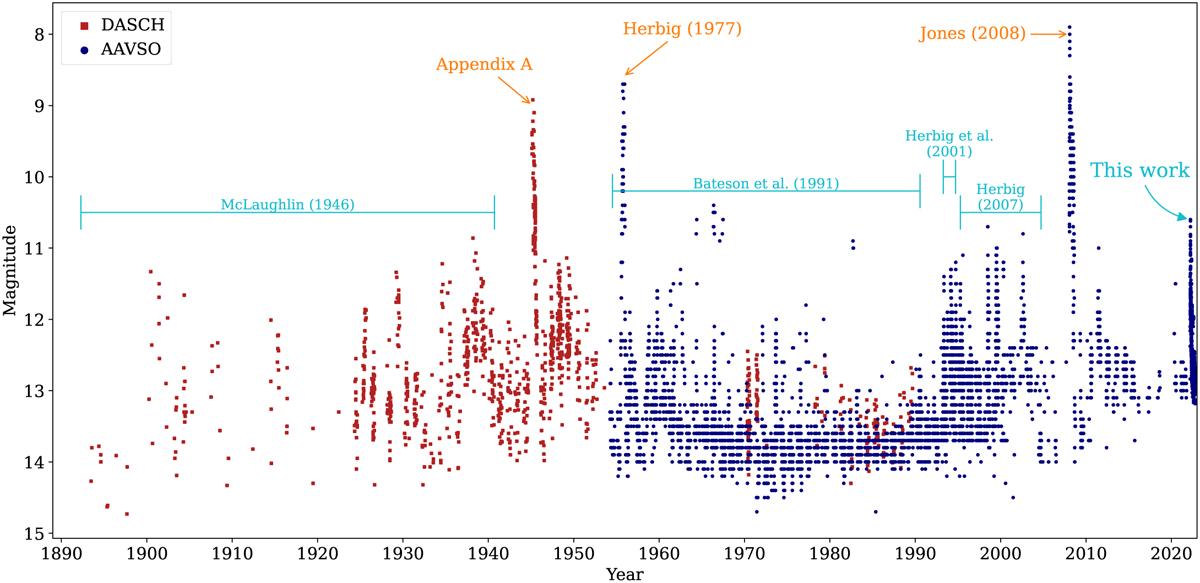
Light curve of EX Lupi spanning the last ~130 yr. The photometry is a combination of Visible and V magnitudes taken from DASCH (red markers) and AAVSO (blue markers). It shows three large outbursts in 1944 (see Appendix A), 1955 (Herbig 1977) and 2008 (Jones 2008), multiple bursts reported by McLaughlin (1946), Bateson et al. (1991), Herbig et al. (2001), Herbig (2007) and the one presented in this work (see Fig. 2).
Current usage metrics show cumulative count of Article Views (full-text article views including HTML views, PDF and ePub downloads, according to the available data) and Abstracts Views on Vision4Press platform.
Data correspond to usage on the plateform after 2015. The current usage metrics is available 48-96 hours after online publication and is updated daily on week days.
Initial download of the metrics may take a while.