Fig. 5.
Download original image
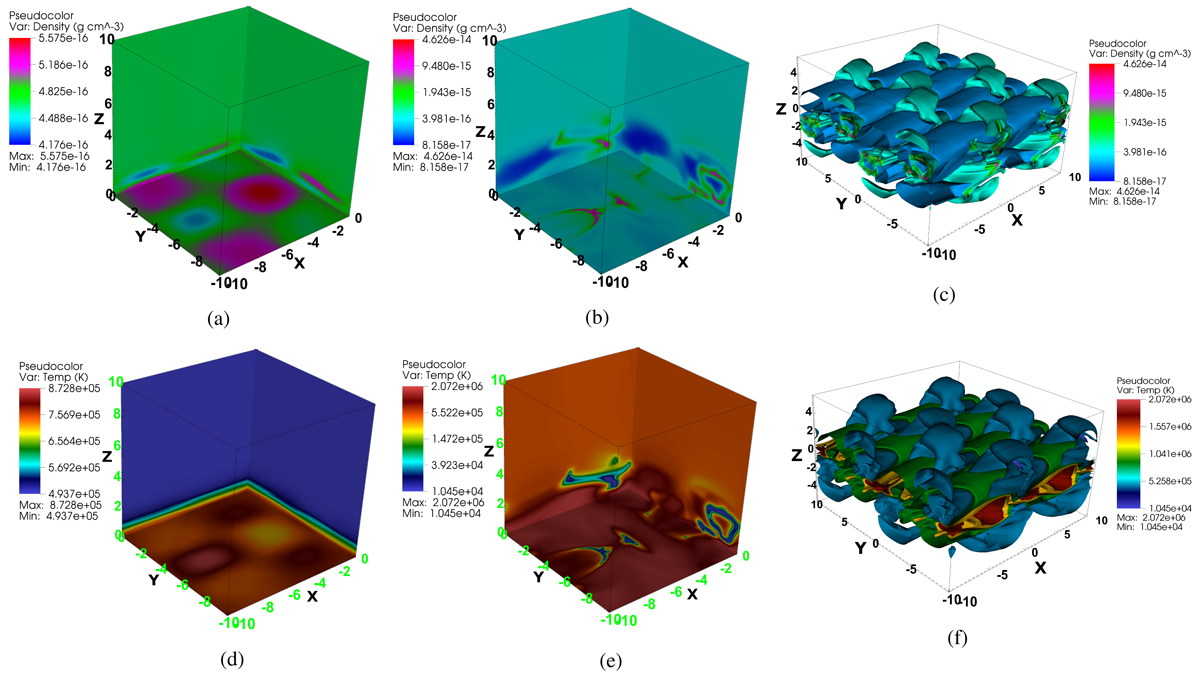
Spatial distribution of density (top panel) and temperature (bottom) in the 3D domain, where the distances along the x, y, and z directions are in units of 104 km. Density (a and b) and temperature (d and e) distribution along three orthogonal slices along the x = 0, y = 0, and z = 0 planes for two different times, t = 14.3 and 207.5 min, are shown. (c) and (f) represent isosurface views (five isosurfaces ranging from minimum to maximum values) of density and temperature, respectively. Panels (a) and (d) are the early phase of the evolution, where the density and temperature inhomogeneities appear around the current sheet plane due to the multimode magnetic field perturbation. Panels (b) and (c) illustrate where high-density structures appear, cospatial with cool (∼104 K) regions in (e) and (f). An animation is available online.
Current usage metrics show cumulative count of Article Views (full-text article views including HTML views, PDF and ePub downloads, according to the available data) and Abstracts Views on Vision4Press platform.
Data correspond to usage on the plateform after 2015. The current usage metrics is available 48-96 hours after online publication and is updated daily on week days.
Initial download of the metrics may take a while.