Fig. 3.
Download original image
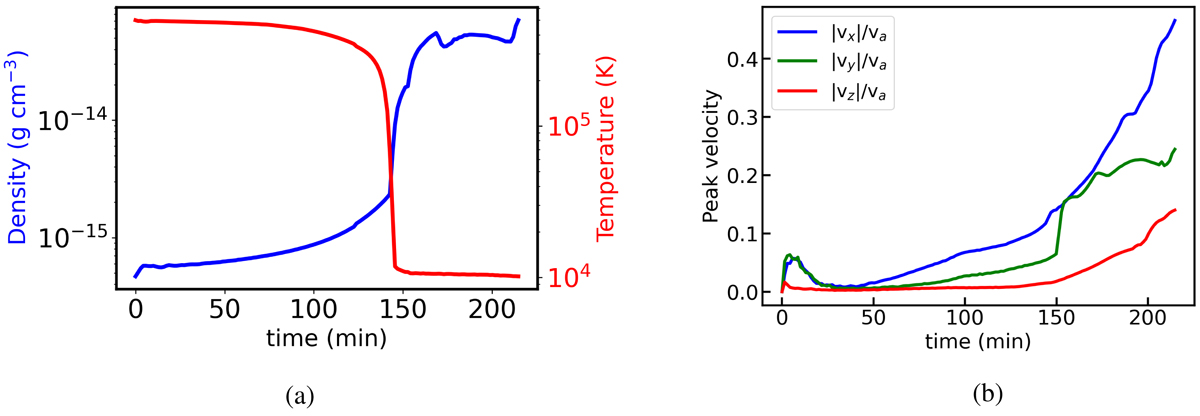
Temporal variation in the (a) instantaneous maximal plasma density (blue line), and minimum temperatures (red line), and (b) instantaneous absolute peak velocities. The sharp rise in the density, and drop in the minimum temperature over two orders of magnitude at ≈150 min, signals the runaway thermal instability causing local condensations, when the absolute peak velocities, vx, vy, and vz, also rise sharply. Here, the velocities are scaled in terms of the Alfvén velocity, va ≈ 261 km s−1.
Current usage metrics show cumulative count of Article Views (full-text article views including HTML views, PDF and ePub downloads, according to the available data) and Abstracts Views on Vision4Press platform.
Data correspond to usage on the plateform after 2015. The current usage metrics is available 48-96 hours after online publication and is updated daily on week days.
Initial download of the metrics may take a while.