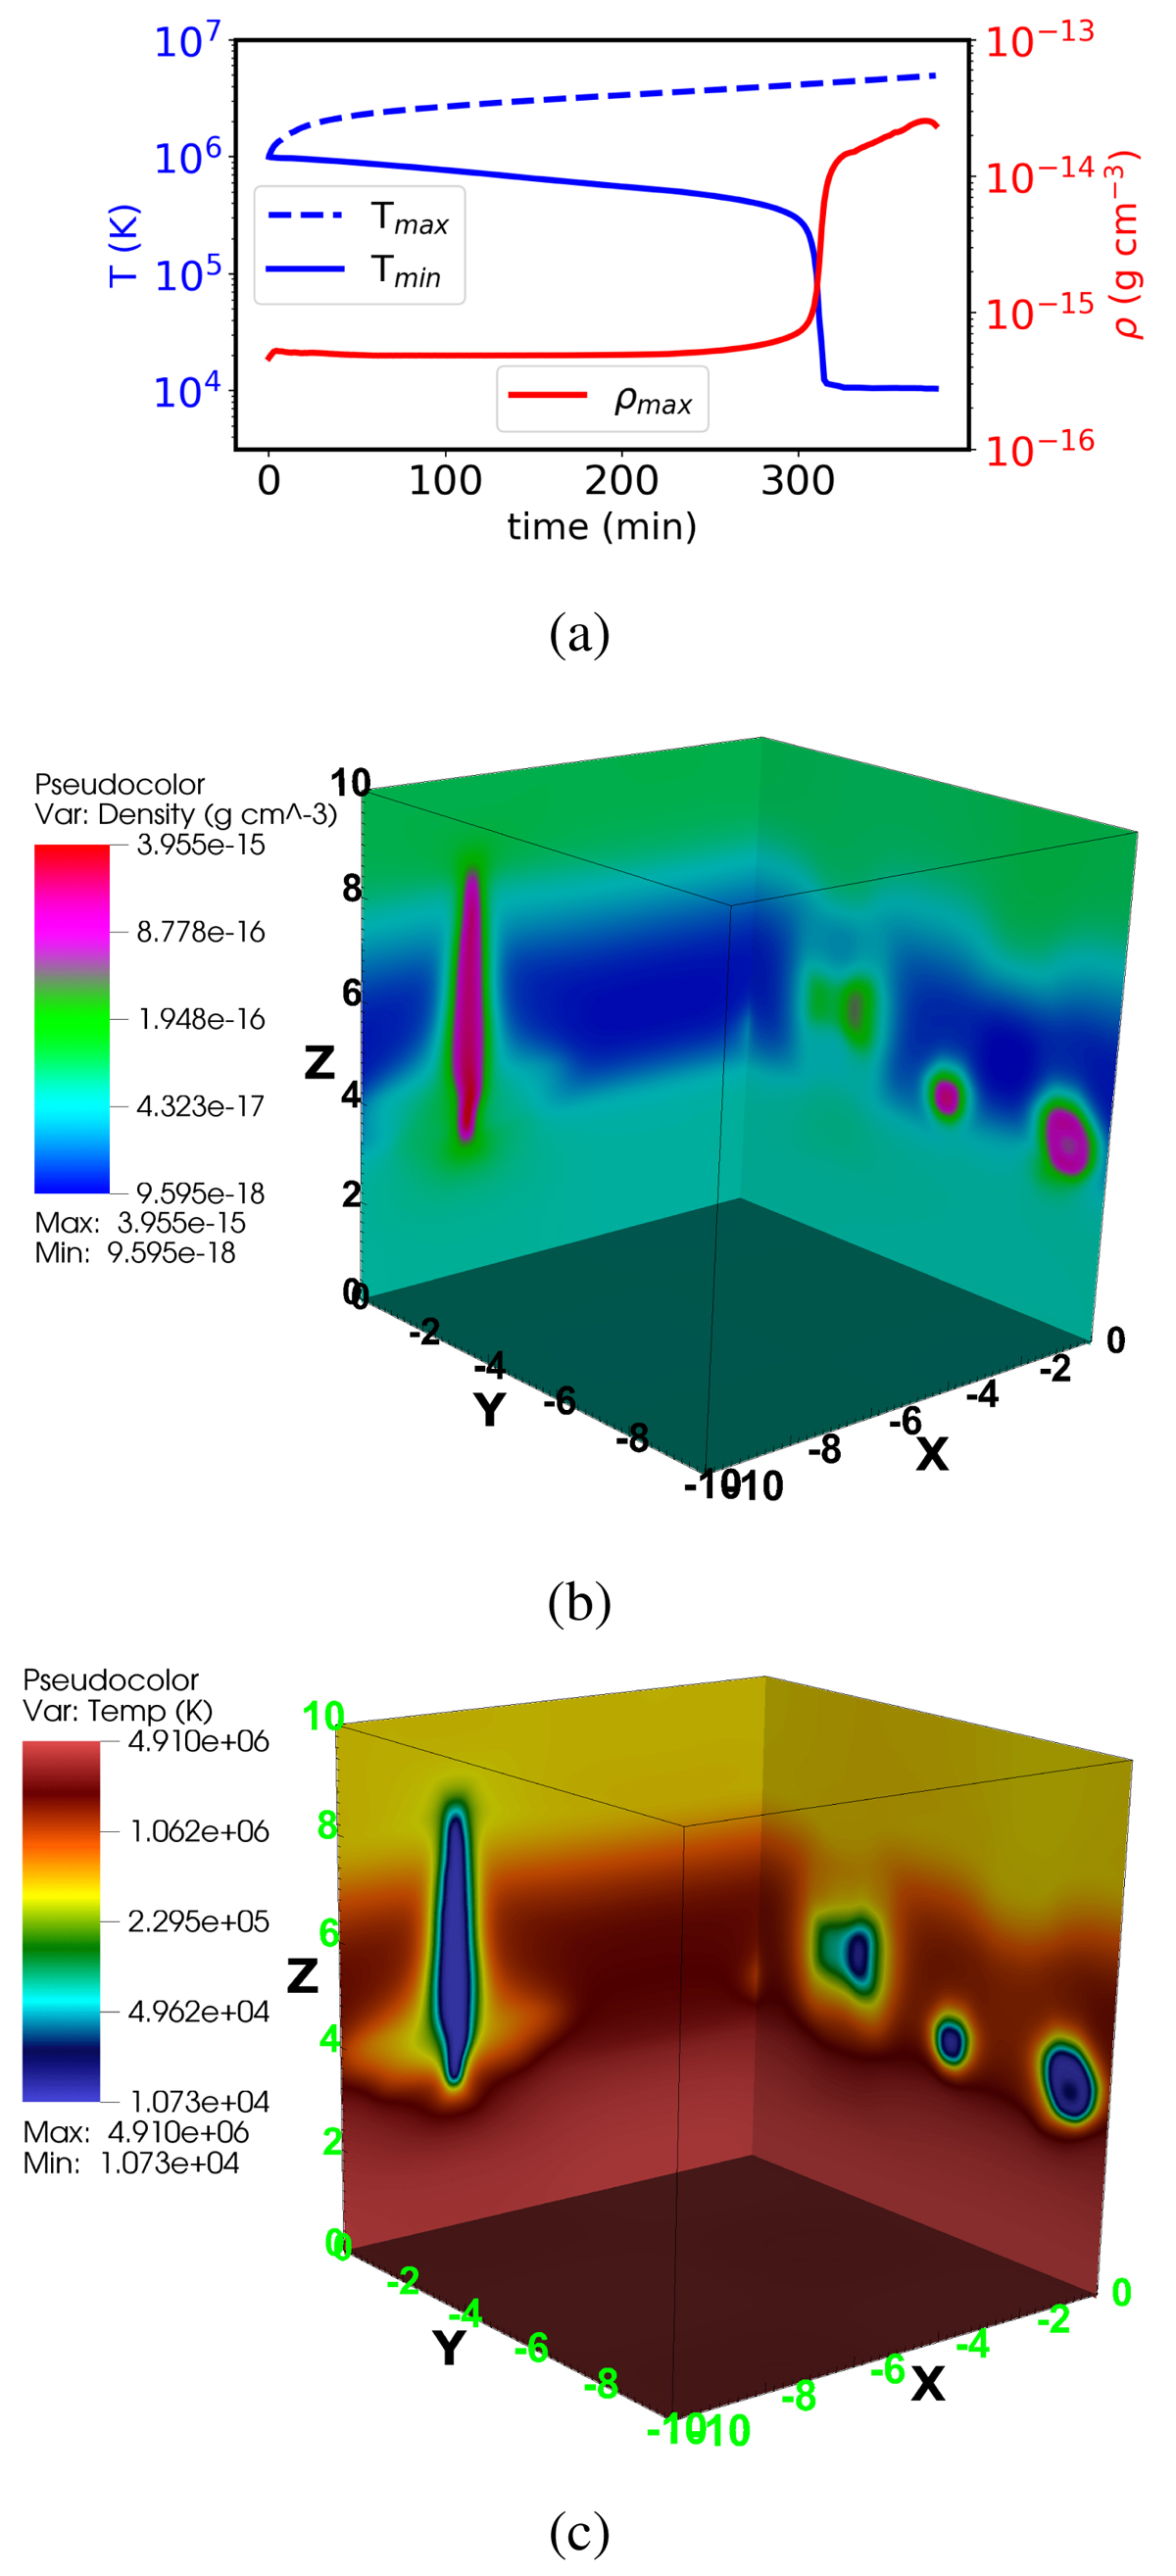
Fig. A.1.
Download original image
(a) represents the temporal evolution of the instantaneous peak density (red curve), and the maximum and minimum temperatures (dashed blue and solid blue, respectively). (b) and (c) represent the density and temperature distribution between x, y ∈ [ − 10, 0], and z ∈ [0, 10] at t = 372 min, respectively, where x, y, and z are in units of 104 km.
Current usage metrics show cumulative count of Article Views (full-text article views including HTML views, PDF and ePub downloads, according to the available data) and Abstracts Views on Vision4Press platform.
Data correspond to usage on the plateform after 2015. The current usage metrics is available 48-96 hours after online publication and is updated daily on week days.
Initial download of the metrics may take a while.