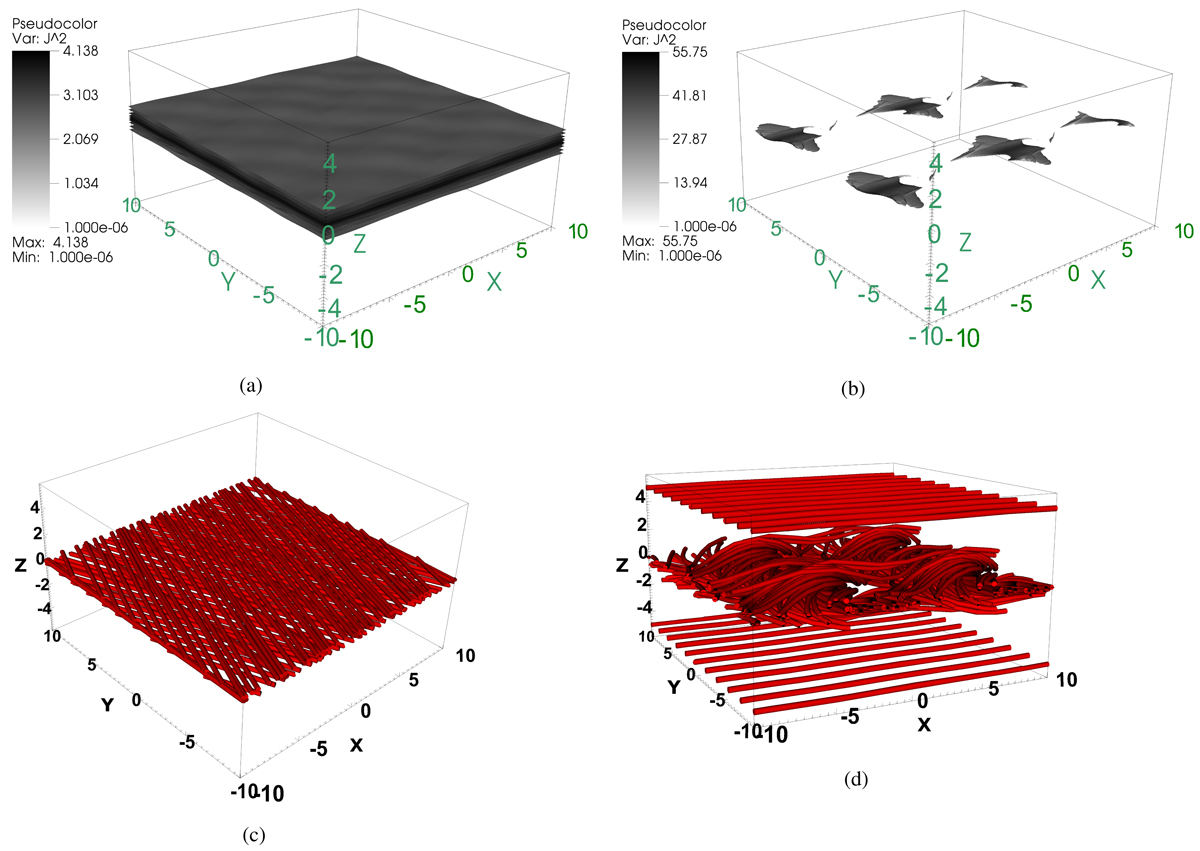
Fig. 1.
Download original image
Isosurface (five isosurface values are taken from instantaneous minimum to maximum) plots of the current density squared J2, which represent the 3D structure of the evolving current sheet. Panel (a) represents the perturbations appearing in the current sheet plane due to the multimode (n1 = 4, n2 = 2) magnetic field perturbations in Eqs. (13)–(14), and (b) represents a time when the current sheet disintegrated due to the tearing-thermal coupled evolution of the system. Panels (c) and (d) represent the magnetic field corresponding to panels (a) and (b), respectively. Distances along the x, y, and z axes are scaled in units of 104 km, where we see the field lines perturbed at 14.3 min around the current sheet plane only, which evolves to sizeable flux rope structures at 207.5 min. An animation of the figures is available online.
Current usage metrics show cumulative count of Article Views (full-text article views including HTML views, PDF and ePub downloads, according to the available data) and Abstracts Views on Vision4Press platform.
Data correspond to usage on the plateform after 2015. The current usage metrics is available 48-96 hours after online publication and is updated daily on week days.
Initial download of the metrics may take a while.