Fig. 2
Download original image
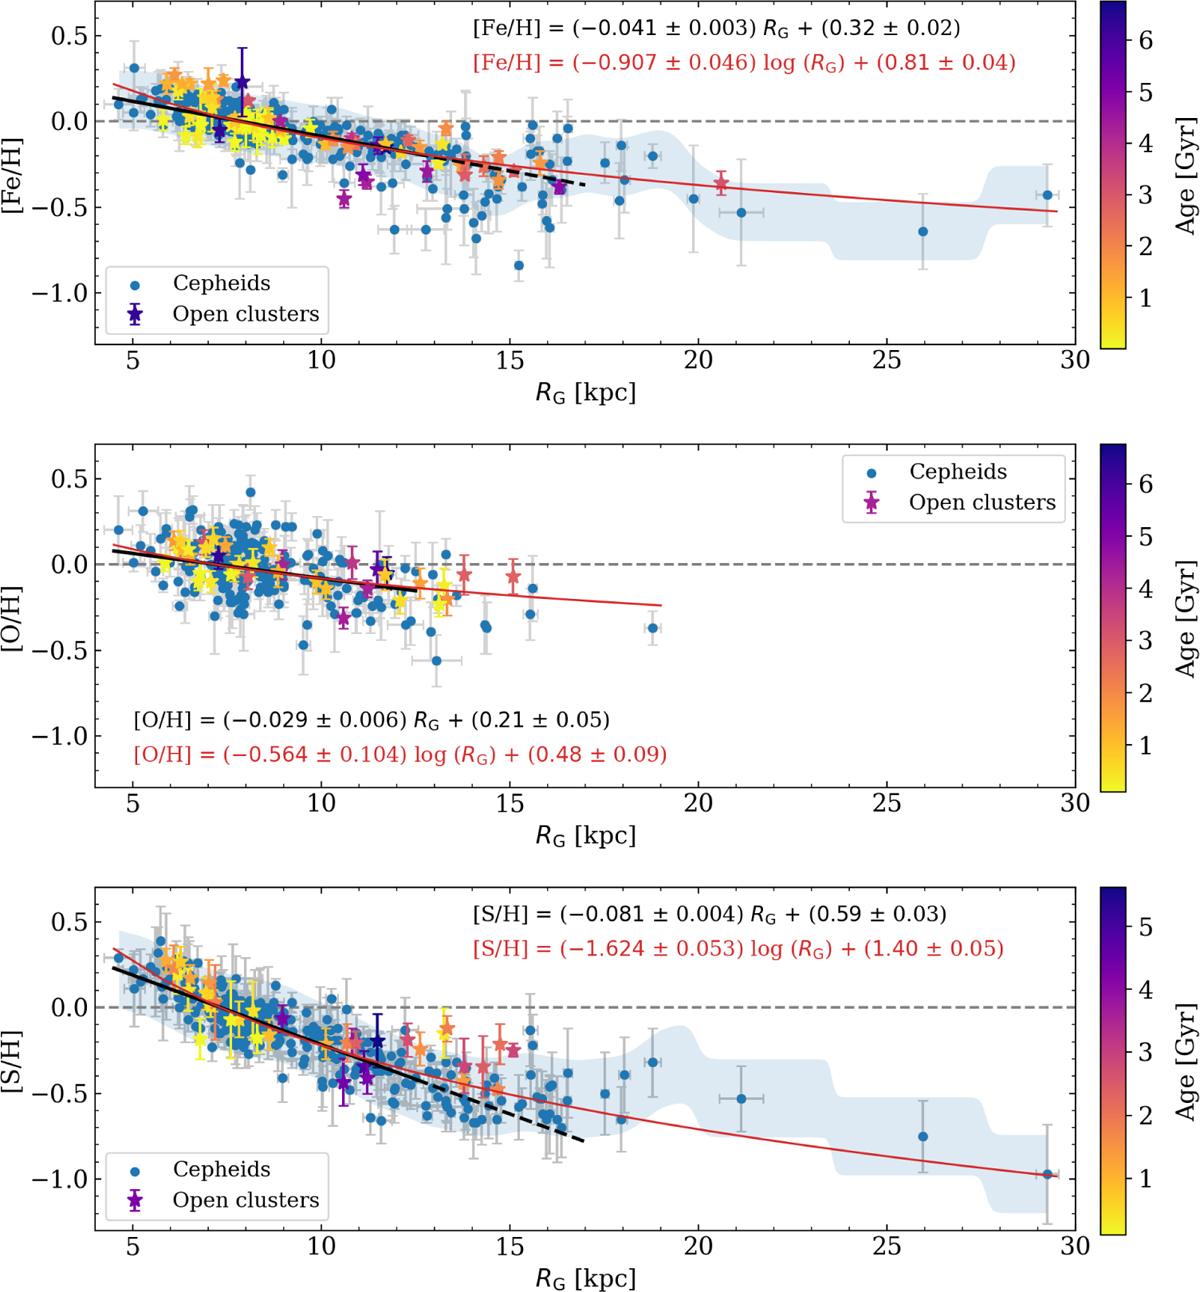
Abundance ratios as a function of the galactocentric distance. Our sample of Cepheids (blue circles) is compared with our sample of open clusters (symbols color-coded according to the stellar age). The Fe and O abundance ratios are taken from Magrini et al. (2023), whereas the S abundances are taken from the present work. The black line displays a linear regression fitted to Cepheids in the range of galactocentric distance from 4 to 12.5 kpc, and the dashed line is the extrapolation up to 17 kpc. The red line shows a logarithmic fit over the whole range of galactocentric distances. The corresponding equations are also shown. The shaded area shows one standard deviation around the running mean, weighted with a Gaussian function taking the errors into account.
Current usage metrics show cumulative count of Article Views (full-text article views including HTML views, PDF and ePub downloads, according to the available data) and Abstracts Views on Vision4Press platform.
Data correspond to usage on the plateform after 2015. The current usage metrics is available 48-96 hours after online publication and is updated daily on week days.
Initial download of the metrics may take a while.