Fig. A.1
Download original image
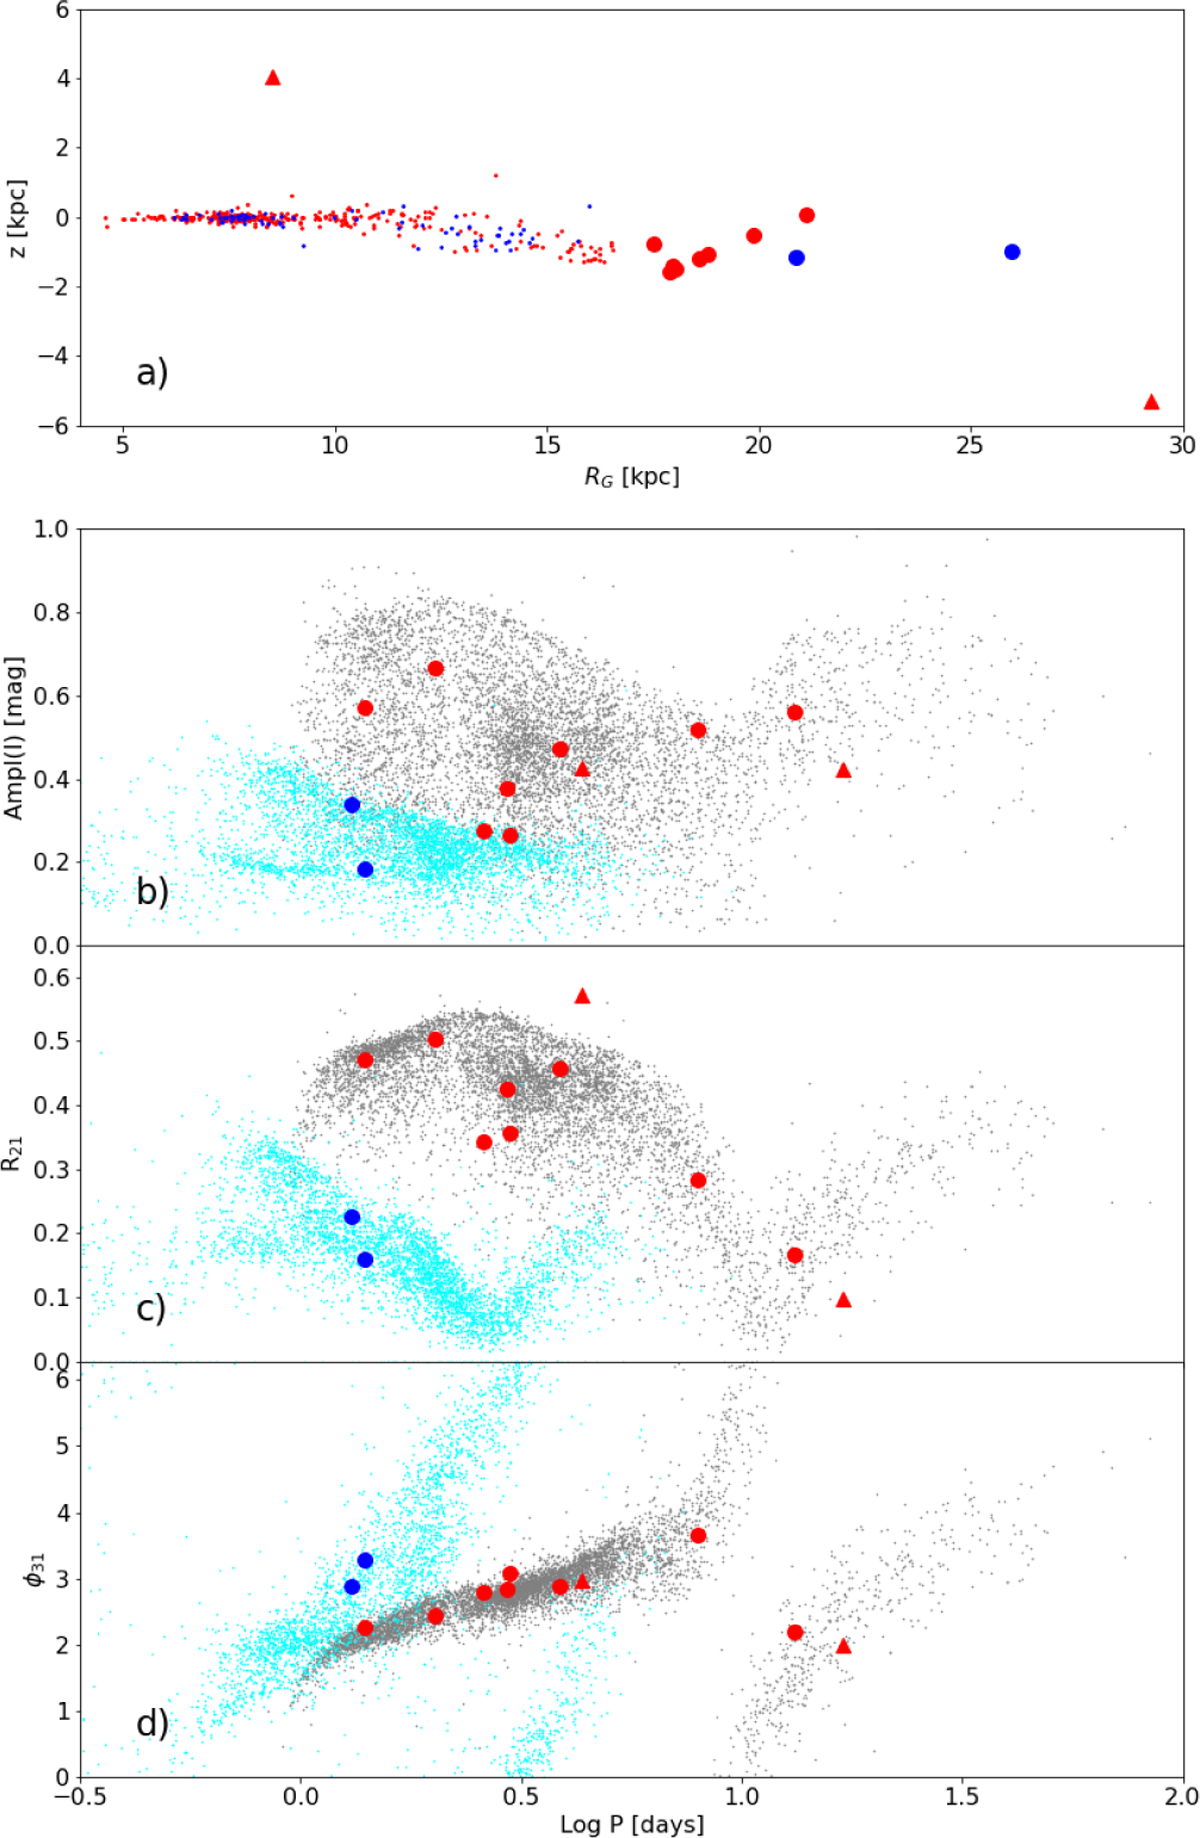
Height from the Galactic plane, Bailey diagram, and Fourier parameters. Panel a) Distance from the Galactic plane as a function of the galactocentric distance for the current sample of 379 classical Cepheids. Panel b) Bailey diagram: I-band luminosity amplitude as a function of the logarithmic pulsation period. The gray and cyan dots display the fundamental (FU) and first overtone (FO) Galactic CCs, respectively, collected by OGLE IV. The red triangles indicate two of our Cepheids for which only the V-band light curves are available (Jayasinghe et al. 2021, ASAS-SN V) and that were transformed into the I band using an amplitude ratio of 1.61 (see Klagyivik & Szabados 2009). The red and blue circles display FU and FO Cepheids located in the outermost disk region. Panels c) and d) Same as in panel (b), but showing the R21 and the φ31 Fourier parameters. For the two CCs with V-band light curves alone, the Fourier parameters were transformed into the I band using the empirical relations from Ngeow et al. (2003).
Current usage metrics show cumulative count of Article Views (full-text article views including HTML views, PDF and ePub downloads, according to the available data) and Abstracts Views on Vision4Press platform.
Data correspond to usage on the plateform after 2015. The current usage metrics is available 48-96 hours after online publication and is updated daily on week days.
Initial download of the metrics may take a while.