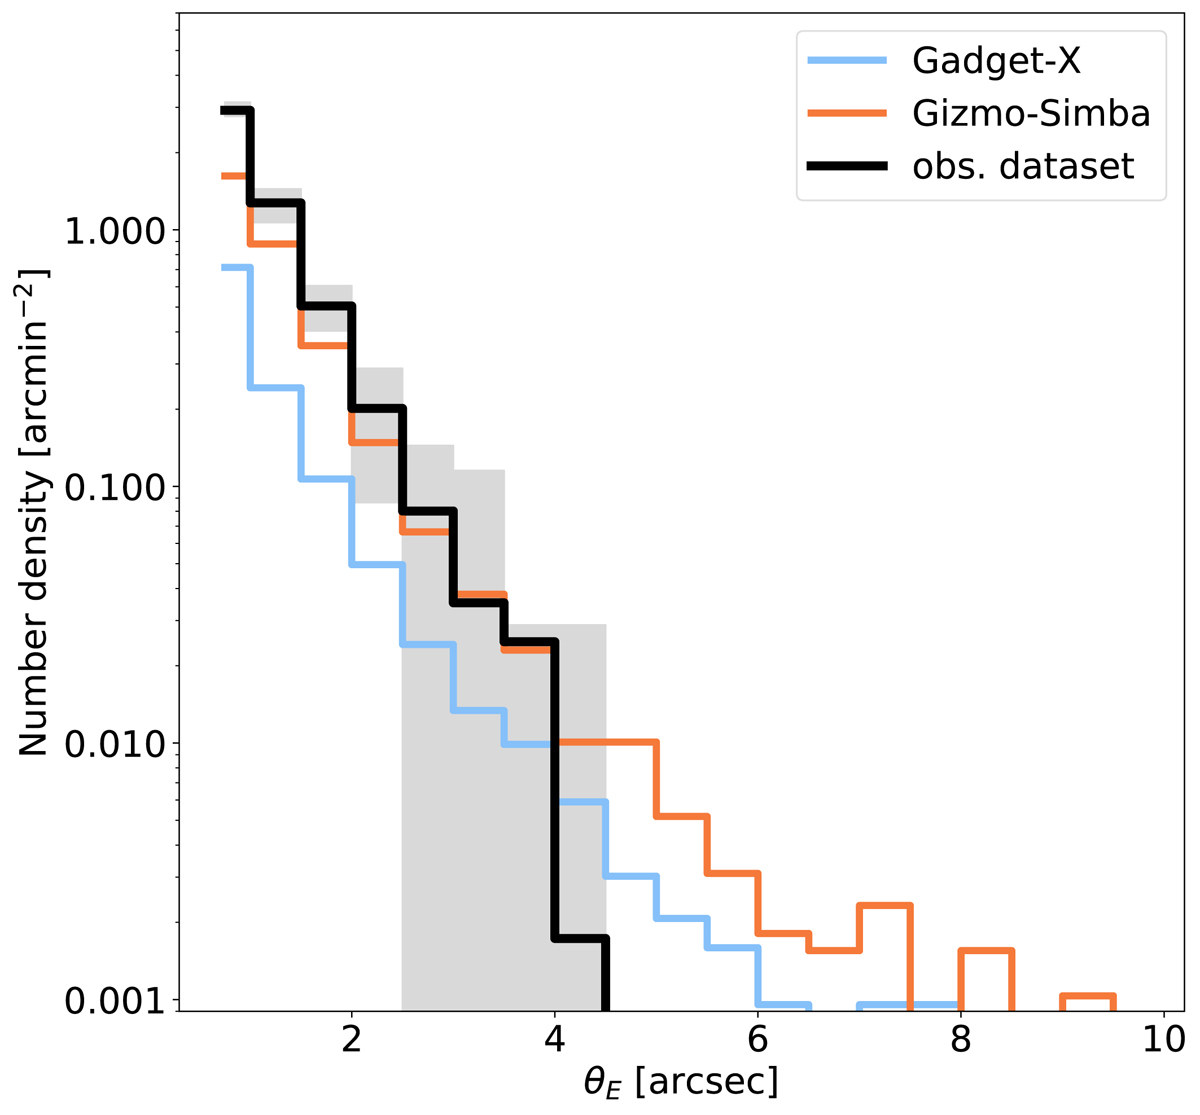
Fig. 2.
Download original image
Number density of secondary critical lines (for zs = 6) as a function of their equivalent Einstein radius θE. The results for the observational dataset are shown with the black histogram. The gray band indicates the range between the minimum and maximum number density among 100 cluster realizations obtained by randomly sampling the posterior distributions of the lens model parameters. The light blue and orange histograms show the results for the GADGET-X and GIZMO-SIMBA simulation datasets, respectively. For this figure only clusters with Einstein radii θE, p(zS = 6) > 26″ in the redshift range 0.3 < zL < 0.45 were used.
Current usage metrics show cumulative count of Article Views (full-text article views including HTML views, PDF and ePub downloads, according to the available data) and Abstracts Views on Vision4Press platform.
Data correspond to usage on the plateform after 2015. The current usage metrics is available 48-96 hours after online publication and is updated daily on week days.
Initial download of the metrics may take a while.