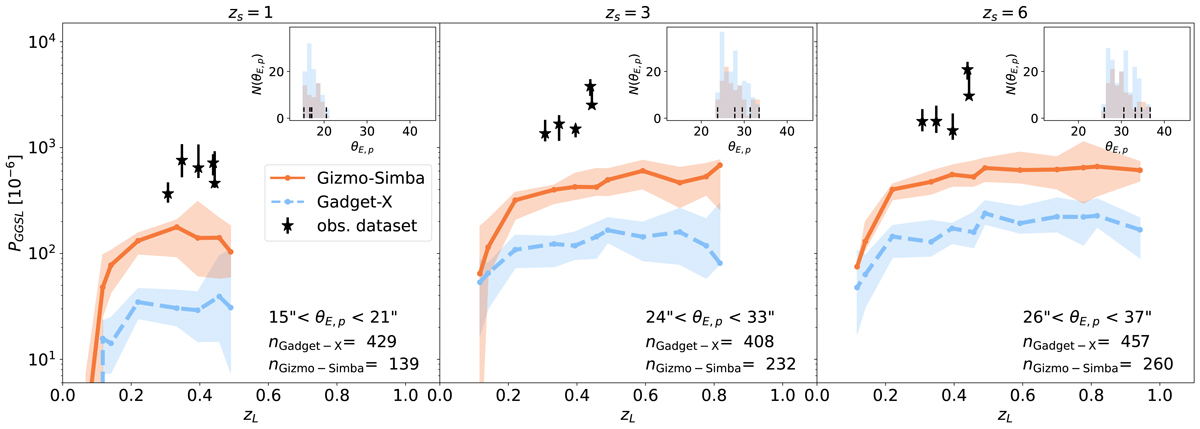
Fig. 1.
Download original image
Median GGSL probability as a function of lens redshift for galaxy clusters with primary Einstein radii θE, p in the range of the observational dataset. From left to right, the three panels refer to source redshifts zS = 1, zS = 3, and zS = 6. The results for the GIZMO-SIMBA and GADGET-X runs are shown as solid orange and dashed blue lines. The colored bands show the 99.9% confidence intervals for each dataset. The θE, p selection limits are reported in each panel and correspond to the range between the minimum and maximum of the primary Einstein radii of the observed clusters for a given source redshift. The number of cluster projections satisfying the selection criteria in the two simulation datasets (nGizmo − Simba and nGadget − X) are also reported in each panel. The black stars show the GGSL probability of the clusters in the observational dataset with associated 99.9% confidence limits derived from the posterior distributions of the lens model parameters. The insets in the upper right corners show the distributions of primary Einstein radii in the selected simulation samples, limited to the redshift range 0.3 < zL < 0.45. The vertical black dashed lines show the measured values in the observational dataset.
Current usage metrics show cumulative count of Article Views (full-text article views including HTML views, PDF and ePub downloads, according to the available data) and Abstracts Views on Vision4Press platform.
Data correspond to usage on the plateform after 2015. The current usage metrics is available 48-96 hours after online publication and is updated daily on week days.
Initial download of the metrics may take a while.