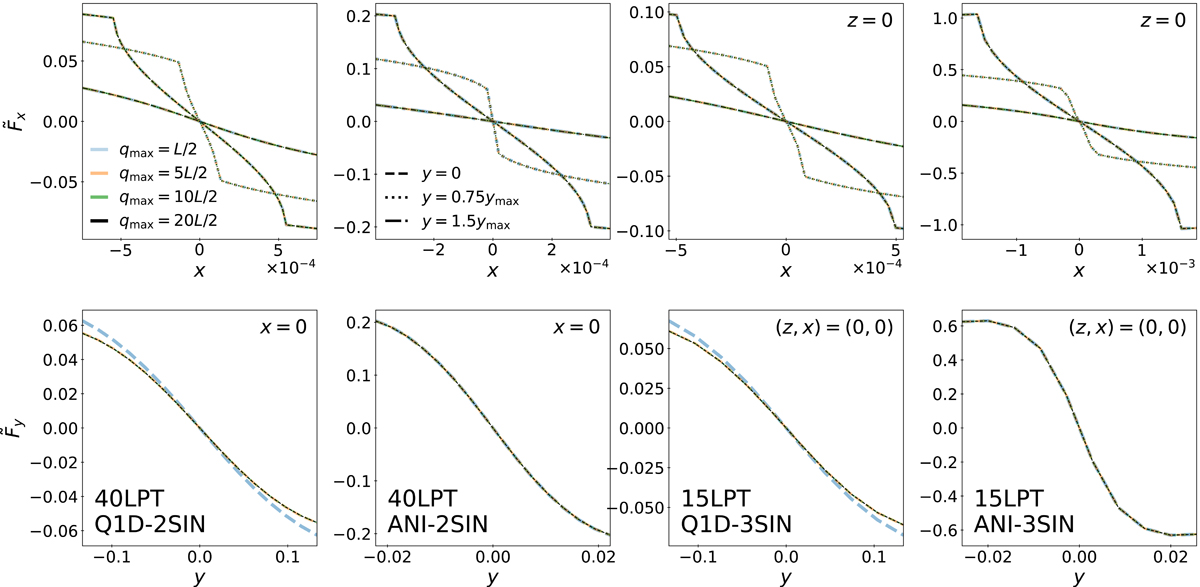
Fig. B.1.
Download original image
Tests of the choice of the bounds of integral (14). The x and y coordinates of the force are plotted, respectively, in the top and bottom panels, for various choices of the integration range [ − qmax, qmax] with qmax ranging from L/2 to 20L/2, as indicated in the upper-left panel. From left to right, we consider Q1D-2SIN, ANI-2SIN, Q1D-3SIN, and ANI-3SIN initial conditions. In the top panels, various values of y are considered, as indicated in the second panel of the top row, while the bottom panels only assume x = 0 since other values of x would not lead to significantly different results. We also set z = 0 in the 3D cases considered in the two top-right and two bottom-right panels. Note that the output time chosen in this figure is the same as in Fig. 5. We see that all the curves corresponding to different values of qmax are superimposed on each other, except for qmax = L/2 for the Q1D cases.
Current usage metrics show cumulative count of Article Views (full-text article views including HTML views, PDF and ePub downloads, according to the available data) and Abstracts Views on Vision4Press platform.
Data correspond to usage on the plateform after 2015. The current usage metrics is available 48-96 hours after online publication and is updated daily on week days.
Initial download of the metrics may take a while.