Fig. A.1.
Download original image
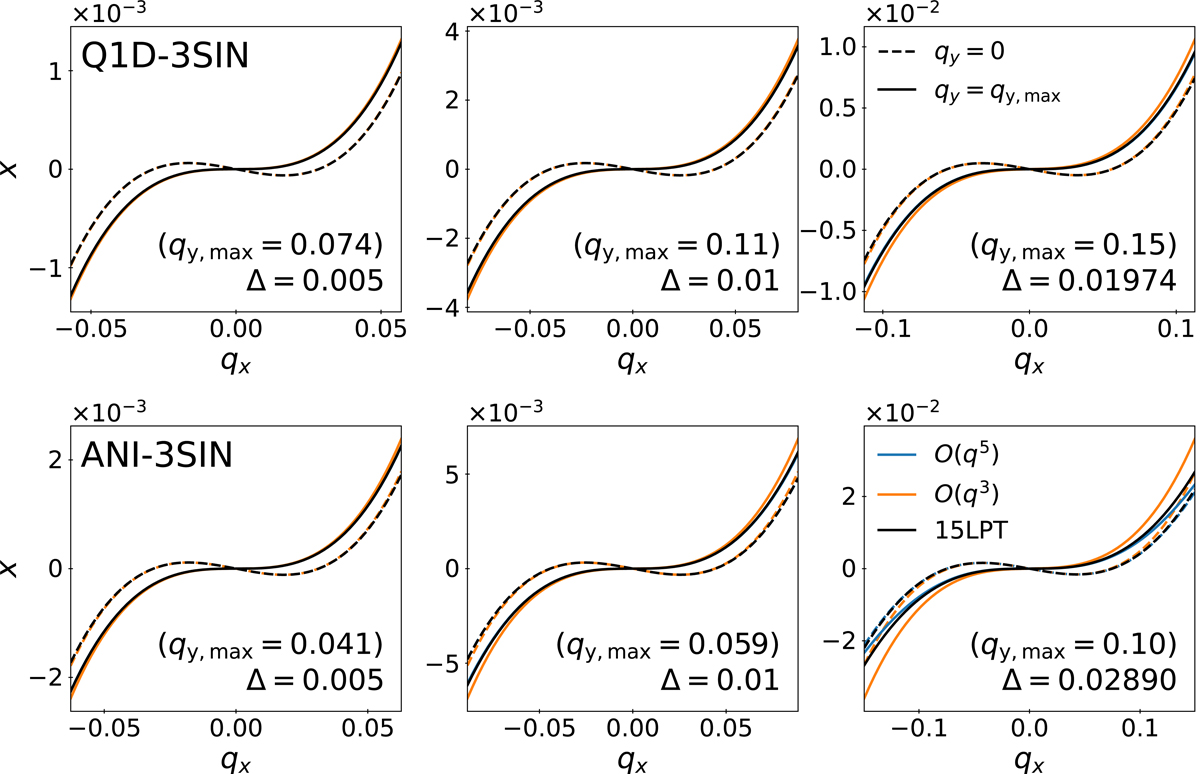
x coordinate as a function of qx for Q1D-3SIN (top panels) and ANI-3SIN (bottom panels) initial conditions at various output times, with Δ = 0.005 (left), 0.01 (centre), and Δsim = asim/asc − 1, as given in the right column of Table 1 (right). The solid and dashed curves correspond to qy = 0 and ![]() , where
, where ![]() is the maximum extension of the caustic in Lagrangian space along the qy-axis, while qz = 0. We present the results predicted by the pure 15LPT solution (black) and its Taylor expansion expression in the Lagrangian coordinate up to up to 𝒪(q3) (orange) and up to 𝒪(q5) (blue).
is the maximum extension of the caustic in Lagrangian space along the qy-axis, while qz = 0. We present the results predicted by the pure 15LPT solution (black) and its Taylor expansion expression in the Lagrangian coordinate up to up to 𝒪(q3) (orange) and up to 𝒪(q5) (blue).
Current usage metrics show cumulative count of Article Views (full-text article views including HTML views, PDF and ePub downloads, according to the available data) and Abstracts Views on Vision4Press platform.
Data correspond to usage on the plateform after 2015. The current usage metrics is available 48-96 hours after online publication and is updated daily on week days.
Initial download of the metrics may take a while.